14 Day Trading Patterns You Need To Know
BY Janne Muta
|Februar 29, 2024Day trading involves buying and selling financial instruments within the same trading day, ensuring positions are not held overnight. This approach demands a keen understanding of day trading patterns, which are crucial for navigating the swift changes in market prices. These patterns help traders make informed decisions by highlighting potential price movements and trading opportunities.
Among the strategies employed, scalping stands out for its rapid trade execution over minutes, capitalizing on small price gaps. Similarly, news trading is significant, where traders leverage price movements driven by news announcements. Mastery of these patterns is indispensable for traders aiming to profit from the day's market volatility. Embracing such strategies, alongside a deep comprehension of day trading patterns, paves the way for successful intraday transactions. Once read this article visit our account opening page to get started.
Day trading patterns you need to know
Chart patterns play a pivotal role in day trading, offering deep insights into market psychology and potential future price movements. These patterns, whether they are candlestick formations, trend lines, or price action configurations, serve as visual cues for traders to decipher market sentiment. Candlestick patterns, in particular, are invaluable for identifying trend reversals and continuations. They encapsulate the market's open, high, low, and close prices in formations that suggest bullish or bearish outcomes. Through the analysis of these patterns, traders can anticipate market movements with greater accuracy, making informed decisions on entry and exit points. The utility of chart patterns extends beyond mere prediction; it empowers traders to align their strategies with the underlying market trends, enhancing the likelihood of profitable trades.
Key takeaways from this article
- Day trading patterns are essential for traders to navigate the rapid changes in market prices, offering insights into potential price movements and trading opportunities. Mastery of these patterns, including scalping and news trading, is crucial for successful intraday transactions.
- Chart patterns provide deep insights into market psychology and future price movements, with candlestick formations playing a key role in identifying trend reversals and continuations, aiding traders in making informed entry and exit decisions.
- Integrating day trading patterns with technical indicators and fundamental analysis enhances trading strategies, offering a more comprehensive view of the market. This holistic approach, including the use of demo accounts for practice, is pivotal for achieving success in day trading.
Core Day Trading Patterns Explained
Understanding day trading patterns is essential for anyone looking to navigate the fast-paced world of day trading successfully. These patterns, observable in the price charts of stocks, currencies, and other financial instruments, offer vital clues about future price movements. By mastering these patterns, traders can refine their strategies for better profitability.
Pattern Recognition and Interpretation
Pattern recognition and interpretation are fundamental skills for successful day trading. Traders must adeptly identify various chart patterns and understand their implications to make informed decisions. Candlestick patterns, such as engulfing patterns and dojis, provide valuable insights into market sentiment and potential reversals. Additionally, recognising trend continuation patterns like bullish and bearish marubozu or flag formations is crucial for aligning trading strategies with prevailing market trends. Beyond candlesticks, chart patterns like triangles and flags offer further opportunities for traders to anticipate price movements. Interpretation involves not only recognising these patterns but also understanding their significance within the broader market context. By combining pattern recognition with technical indicators and fundamental analysis, traders can develop a comprehensive understanding of market dynamics and enhance their trading efficacy. Ultimately, mastering pattern recognition and interpretation empowers traders to navigate the complexities of the financial markets with confidence and precision.
Candlestick Patterns
Candlestick patterns are foundational to technical analysis in day trading. They provide visual cues about market sentiment and potential price movements, serving as a crucial decision-making tool for traders.
Key Reversal Patterns
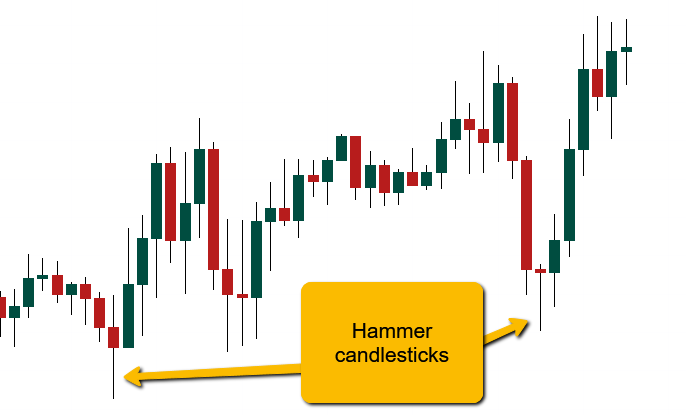
Hammer
A hammer in candlestick charting forms when a security opens low, but rallies to close near the opening, creating a hammer-shaped candlestick. This is one of the most important day trading patterns. It signals a potential price reversal after a decline, with a small body and a long lower shadow. Confirmation of an upward reversal happens when the next candle closes above the hammer's closing price. Traders often use hammers alongside other analyses for confirmation and typically place stop-loss orders below the hammer's shadow.
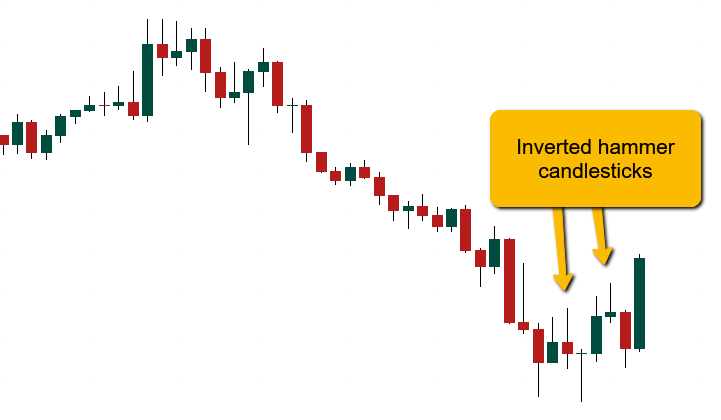
Inverted Hammer
An inverted hammer candlestick, resembling an upside-down hammer, typically appears at the bottom of a downtrend. It features a small body in the lower half of its range, with a long upward wick. This pattern signals a potential bullish reversal, indicating buyers' pressure to drive prices up. Traders watch the next day's price movement for confirmation of a potential uptrend. This pattern can reverse the downtrend, potentially leading to an uptrend.
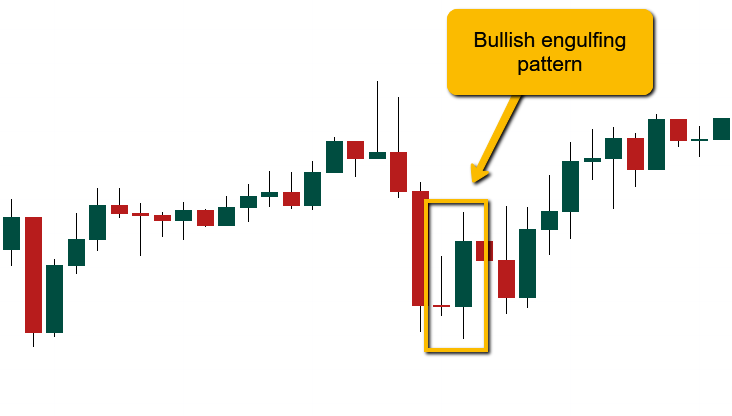
Bullish Engulfing Pattern
The Bullish Engulfing pattern, comprising two candles, signals a potential reversal in a downtrend. The first candle is small and bearish, followed by a larger bullish candle that completely engulfs it. This suggests bears losing control to bulls. Confirmation of reversal occurs when the price surpasses the high of the engulfing candle. The pattern indicates initial bearish control overtaken by bulls, typically with a small upper wick on the engulfing candle.
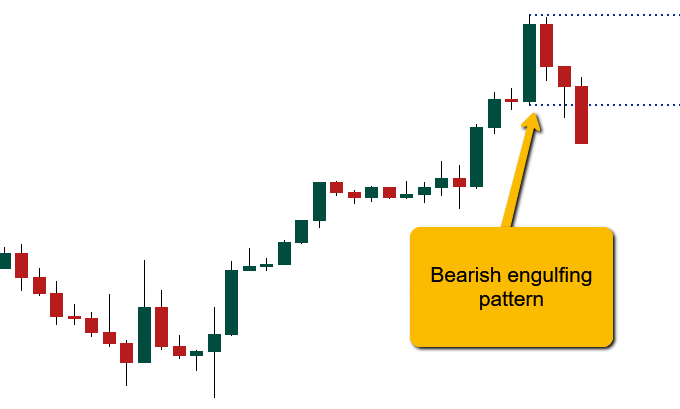
Bearish Engulfing Pattern
The bearish engulfing pattern is a chart pattern signalling a potential reversal from an upward trend to a downward one. It forms with two consecutive candles: a small bullish candle followed by a larger bearish one that engulfs the first. This suggests bears taking control from bulls. Confirmation occurs when the price falls below the low of the engulfing candle. Combining this pattern with other indicators enhances its effectiveness in identifying market reversals.
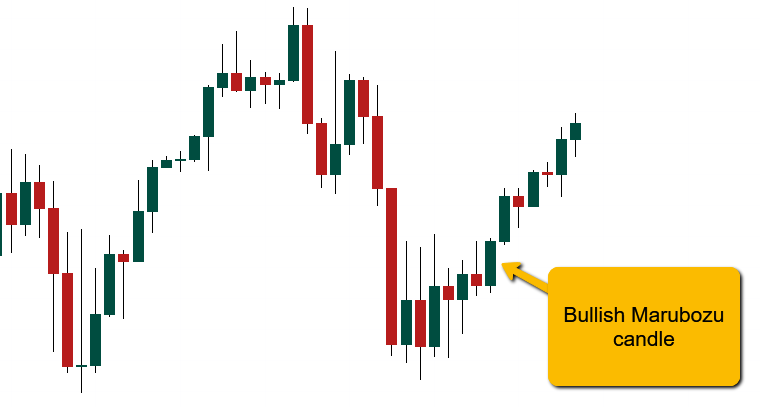
Bullish Marubozu Pattern
The Bullish Marubozu pattern features a long wide-range candlestick with no shadows, indicating strong buying pressure. The opening price equals the low, and the closing price equals the high for the period. It typically occurs at the end of a downtrend or breaks through resistance, signalling bullish momentum. Even if the opening and closing prices aren't exactly the same, the pattern remains valid.
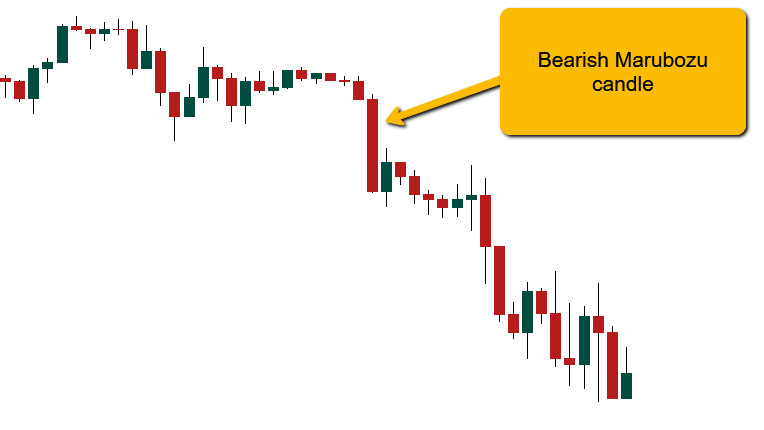
Bearish Marubozu Pattern
The Bearish Marubozu pattern is characterized by a long wide-range candlestick with no upper or lower shadows, indicating strong selling pressure. The opening price equals the high, and the closing price equals the low for the period. This pattern signifies sellers dominating the market, driving prices downwards forcefully, often indicating a continuation of the downtrend. For example, on the chart above during a downtrend, the Bearish Marubozu suggests further price declines are likely.
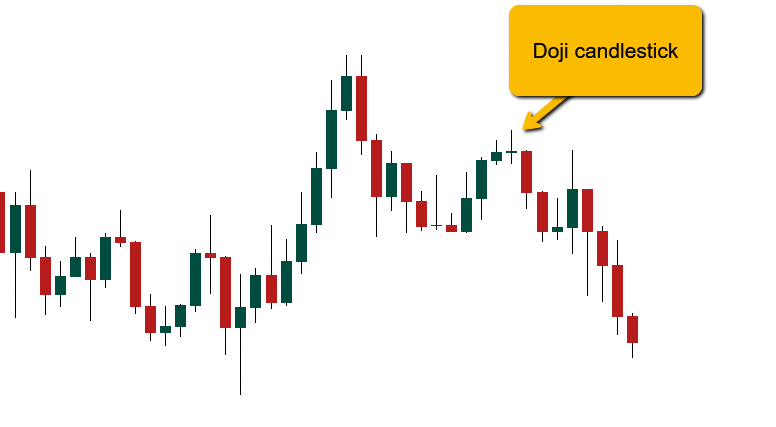
Doji
The Doji candlestick pattern, found in both uptrends and downtrends, features open and close prices nearly equal, resembling crosses or plus signs. While it's a neutral indicator, suggesting trend reversal or indecision, traders use it alongside other indicators for insights. Due to their rarity, Doji patterns aren't always reliable alone. They need to be interpreted together with other day trading patterns to provide clues about market dynamics.
Common Day Trading Chart Patterns
Beyond candlesticks, several chart patterns frequently appear, offering insights into market trends and potential reversals.
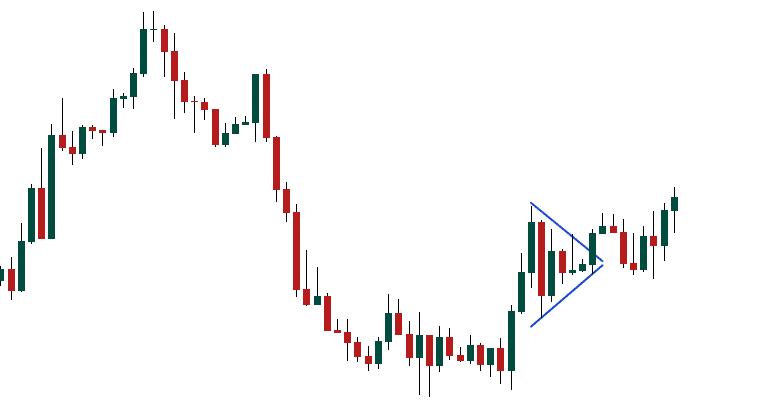
Symmetrical Triangle
The symmetrical triangle pattern, a common formation during consolidation, features two converging trend lines connecting sequential peaks and troughs with roughly equal slopes. Breakout or breakdown targets are calculated by measuring the distance between the initial high and low and applying it to the breakout or breakdown point. Confirmation often involves using other technical analysis tools and day trading patterns. A breakdown from the lower trendline indicates a bearish trend, while a breakout from the upper trendline suggests a bullish trend. Traders typically place stop-loss orders just below the breakout point and combine symmetrical triangles with other indicators for effective analysis.
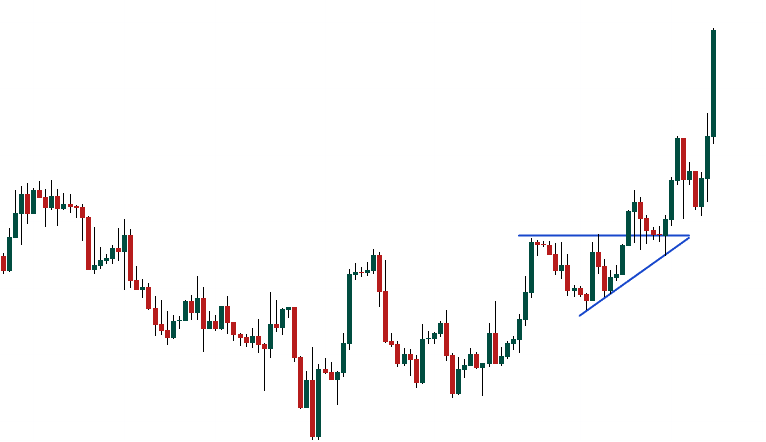
Ascending Triangle
The ascending triangle pattern, seen during uptrends, features higher lows and horizontal resistance formed by connecting swing highs. It's considered a continuation pattern, with breakouts typically in the same direction as the prior trend. Traders enter long positions if the price breaks above the pattern's top and short positions if it breaks below the lower trendline. Stop-loss orders are typically placed outside the pattern, and profit targets are calculated by adding or subtracting the triangle's height from the breakout point. Confirmation factors could include increasing volume and coiled price action within the triangle but that’s not always necessary. While ascending triangles provide clues about trend continuation, they're best used alongside other technical tools.
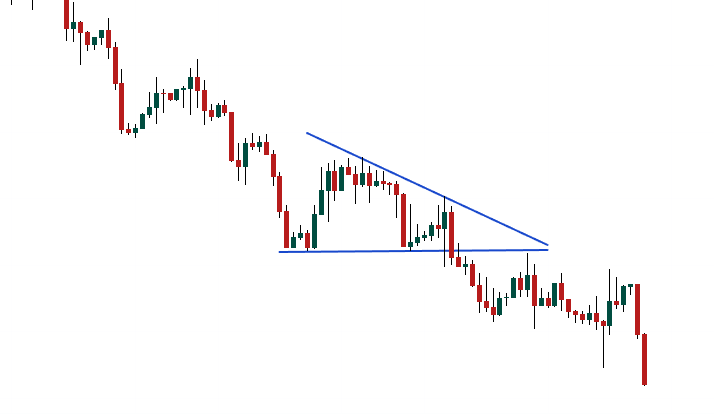
Descending triangle
The descending triangle pattern is a chart formation used in technical analysis, typically appearing after an existing downtrend. It consists of an upper trendline connecting lower highs and a lower horizontal trendline acting as support, signalling weakening demand for the asset. When the price breaks below the lower support, it suggests further downward momentum. Traders often take short positions to profit from anticipated price declines. Combining this pattern with other technical indicators can enhance trading effectiveness.
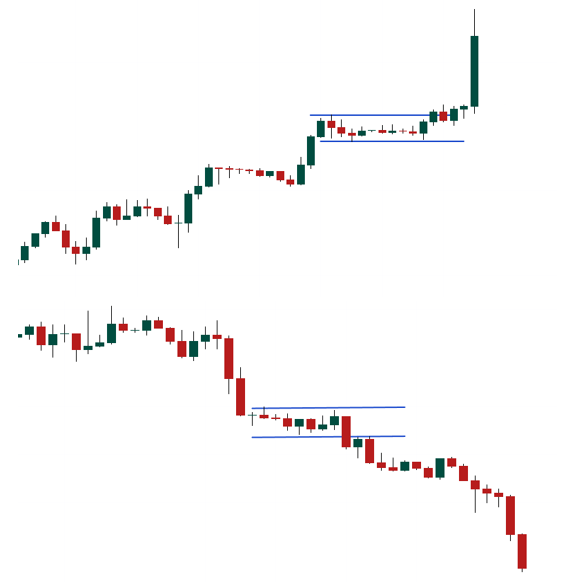
Flag Patterns
Flag patterns, both bullish and bearish, indicate continuation. They resemble a flag on a pole, where the pole represents the initial price movement, and the flag represents a consolidation phase before the trend continues in the direction of the pole. Traders wait for the price to break out of the consolidation to confirm the trend's continuation.
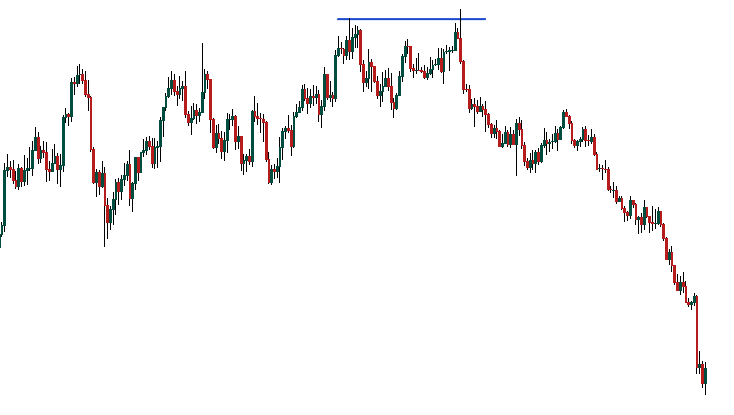
Double Top
A double top formation is a bearish chart pattern and one of the most reliable day trading patterns. It is characterized by two peaks of similar height separated by a trough. It signals a potential trend reversal from bullish to bearish. The pattern forms when an asset fails to break above a previous high, indicating a weakening uptrend. Traders often enter short positions when the price breaks below the trough between the two peaks, targeting a decline in price.
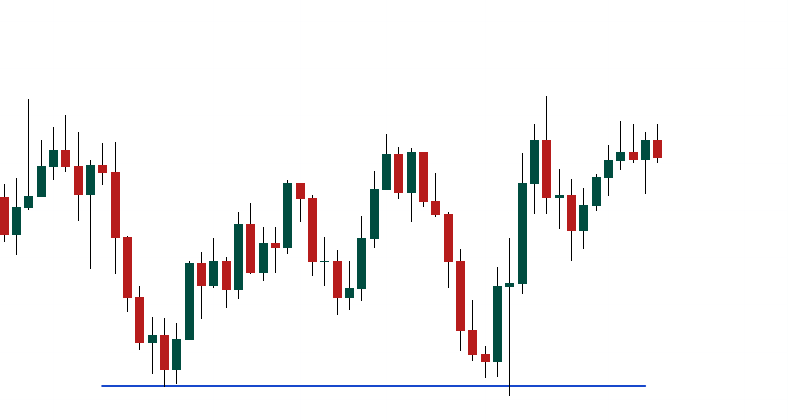
Double Bottom
A double bottom formation is a bullish chart pattern characterized by two troughs of similar depth separated by a peak. It signals a potential trend reversal from bearish to bullish. The pattern forms when an asset fails to break below a previous low, indicating a weakening downtrend. Traders often enter long positions when the price breaks above the peak between the two troughs, targeting an upward price movement.
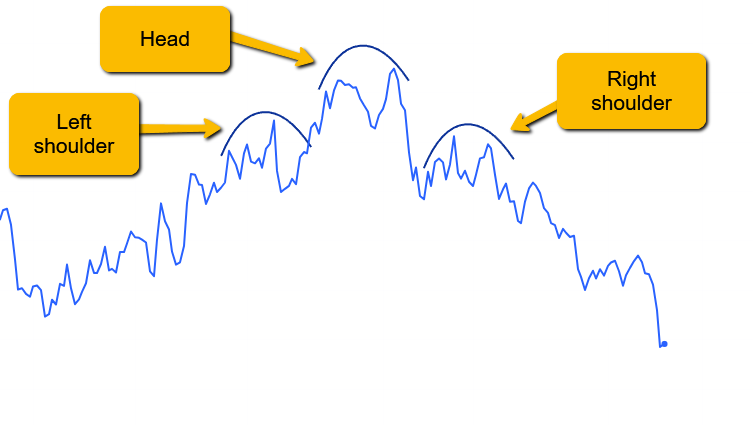
Head and Shoulders and Inverse Head and Shoulders
The head and shoulders formation is a bearish reversal pattern identified by three peaks: a central peak (head) higher than two smaller peaks (shoulders) on either side. It signals a shift from bullish to bearish sentiment. Traders typically enter short positions when the price breaks below the "neckline," a support level connecting the lows of the shoulders. Confirmation often involves increased volume during the breakdown. This pattern is widely watched due to its reliability in predicting downward price movements.
Application of Patterns to Various Financial Instruments
Day trading patterns are not confined to a single market; they span across currencies, cryptocurrencies, and securities, offering versatile tools for traders in different arenas. In the fast-paced forex market, patterns such as flags and pennants can signal quick, significant price movements, essential for leveraging currency pair volatilities. Traders rely on these patterns to navigate the market's inherent volatility, using formations like the head and shoulders to predict potential reversals. In the realm of securities, including stocks and bonds, patterns provide insights into market sentiment, guiding traders through the complexities of intraday movements. Crucially, the analysis of day trading patterns on lower timeframes, such as 1-minute to 1-hour charts, is vital. This approach allows traders to capture the micro-movements essential for day trading success, highlighting the universal applicability of these patterns in capturing short-term market dynamics.
Integrating Patterns with Other Trading Tools
For a comprehensive trading strategy, integrating day trading patterns with technical indicators and fundamental analysis is paramount. Patterns offer a snapshot of market sentiment and potential direction, but combining them with indicators like moving averages, RSI, and MACD can validate these signals, providing a more robust basis for entry and exit decisions. Moreover, fundamental analysis, which examines economic indicators, company earnings reports, and other significant events, adds depth to the understanding of potential market movements. Incorporating market news into the trading decision process is also crucial. News can swiftly alter market sentiment, making it essential for traders to adapt their strategies in real-time. This holistic approach, blending pattern recognition with technical and fundamental analyses, equips traders with a nuanced view of the market, enhancing the likelihood of successful trades and informed decision-making in the fast-paced world of day trading.
Practical Tips for Trading with Patterns
Patience in Pattern Formation
One crucial aspect of trading with day trading patterns is the patience required to wait for a pattern to fully form before executing trades. Jumping in too early, based on incomplete formations, can lead to misinterpretation of market direction and potential losses. It's essential to allow the pattern to develop and provide a clear signal—whether it's a completed head and shoulders pattern indicating a reversal or a fully formed flag pattern suggesting continuation. This disciplined approach helps in making more informed decisions and increases the chances of successful trades.
Implementing Risk Management Strategies
Effective risk management is pivotal when trading with day trading patterns. Setting stop losses is a fundamental strategy, helping to limit potential losses if the market moves against your position. Determining appropriate entry and exit points is also crucial; these should be based on the pattern's structure, ensuring trades are executed at points that offer a favourable risk-reward ratio. For example, entering a trade as the price breaks out of a pattern's resistance level and setting a stop loss just below a support level can protect against downside risk while capitalizing on the pattern's predictive value.
The Value of Demo Accounts and Emotional Discipline
Using demo accounts for practice is invaluable, especially for beginners. These accounts allow traders to apply day trading patterns in real-market conditions without financial risk, enabling skill refinement and strategy testing. Moreover, they offer a safe environment to learn the importance of emotional discipline—patience, avoiding impulsive decisions, and managing the psychological aspects of trading. Mastering these emotional and technical skills in a demo setting can significantly enhance a trader's ability to succeed in the live markets.
An Example: Profiting from a Bullish Flag Pattern
After observing a sharp upward movement in the price, followed by a brief period of consolidation that formed the flag, a trader could decide to enter a long position as soon as the price broke above the flag's upper boundary. This day trading pattern suggested a continuation of the uptrend. The trader set a stop loss just below the flag's lower boundary to minimize potential losses. Within hours, the market surged, following the pattern's predictive direction, and the trader exited at a predetermined profit target, securing a considerable gain. This case underscores the effectiveness of recognizing and acting on bullish flag patterns for timely entries and exits.
Capitalizing on a Head and Shoulders Reversal
Another example involves a forex trader spotting a head and shoulders pattern on a major currency pair. Recognizing this pattern as a bearish reversal signal, the trader placed a short sell order once the price broke below the pattern's neckline, with a stop loss set above the right shoulder to manage risk. The currency pair's price declined sharply after the pattern completion, in line with the day trading pattern's bearish forecast. The trader's strategic use of the head and shoulders pattern not only provided a clear entry signal but also highlighted an optimal exit point for maximizing profits from the trade. This example demonstrates the power of pattern recognition in predicting price reversals and securing profitable outcomes.
Challenges and Limitations of Trading with Patterns
Despite the advantages of using day trading patterns for market analysis, traders must be aware of their limitations. Chart patterns are not foolproof predictors of future price movements; they offer probabilities, not certainties. Over-reliance on patterns without considering other market factors can lead to misjudgements and financial losses. Market conditions, economic indicators, and global events can all impact price movements, sometimes nullifying pattern predictions. Furthermore, the subjective interpretation of patterns can vary among traders, leading to different trading decisions based on the same chart formation. A balanced approach that incorporates comprehensive risk management and considers both technical and fundamental analyses is essential. Continuous education and adapting strategies to evolving market conditions are crucial for mitigating these challenges and enhancing trading efficacy.
Conclusion: Mastering Day Trading Patterns for Success
Mastering day trading patterns is a fundamental aspect of achieving success in the fast-paced world of day trading. These patterns provide valuable insights into potential market movements, offering traders guidance on entry and exit points. However, the journey to trading proficiency does not end with pattern recognition. Continuous learning and the ability to adapt to market changes are paramount for sustaining long-term profitability. Traders should embrace a holistic approach that includes rigorous risk management, an understanding of market fundamentals, and the flexibility to adjust strategies as necessary. By combining these elements with a deep knowledge of day trading patterns, traders can navigate the complexities of the market with greater confidence and achieve sustained success. Now that you understand these concepts visit our account opening page to register and open an account.

Risk disclaimer: CFDs are complex instruments and come with a high risk of losing money rapidly due to leverage. You should consider whether you understand how CFDs work and whether you can afford to take the high risk of losing your money. Never deposit more than you are prepared to lose. Professional client’s losses can exceed their deposit. Please see our risk warning policy and seek independent professional advice if you do not fully understand. This information is not directed or intended for distribution to or use by residents of certain countries/jurisdictions including, but not limited to, USA & OFAC. The Company holds the right to alter the aforementioned list of countries at its own discretion.

Janne Muta holds an M.Sc in finance and has over 20 years experience in analysing and trading the financial markets.
Related Posts


Trade responsibly: CFDs are complex instruments and come with a high risk of losing all your invested capital due to leverage.