Mean Reversion Trading Strategy: Your Ultimate Guide
BY Janne Muta
|Januar 26, 2024Mean reversion is a fundamental concept in finance, widely utilized by hedge funds and professional traders, and forms the basis of the mean reversion trading strategy. This principle suggests that prices, returns, or economic indicators often move back towards their historical averages over time.
Such a tendency indicates that extreme values, whether exceptionally high or low, are typically followed by a reversion towards the mean, signifying a statistical equilibrium.
For retail traders, understanding the concept of mean reversion is crucial, as it enhances their ability to develop effective mean reversion trading strategies, thereby improving their decision-making in various market scenarios.
The structure of this article
I have structure this article as follows to make sure it provides value to both new and more experienced traders alike.
- First, we will study mean reversion as concept using simple and easy to understand graphs.
- Then we briefly touch upon the statistics behind the concept.
- I will then show you how you can apply the concept when planning your trading strategy.
- Next we take a closer look at markets with a statistical tendency to revert to the mean.
Utilizing a mean reversion trading strategy in financial markets
Mean reversion is a pivotal concept in financial markets, essential for traders and investors across forex, stock, bond, and commodities trading. This strategy hinges on the principle that prices tend to return to their historical average. When an asset's price significantly deviates from this mean, traders may buy at lower prices if it's undervalued and sell at higher prices if overvalued, anticipating a return to the average.
The mean reversion trading strategy capitalises on these price deviations. In a sideways market, when an asset's price markedly diverges from its mean, it is often expected to revert, offering potential trading opportunities. By identifying overbought or oversold conditions, traders can make informed decisions, buying low and selling high.
This article aims to guide you in reducing risk and maximising profit. It will assist in distinguishing between trending and non-trending market regimes, aiming for more consistent and, ideally, profitable outcomes.
Mean reversion and different market regimes
In ranging markets, a specific market regime, the mean reversion trading strategy becomes particularly effective. Prices in these markets tend to revert to the mean, indicating that when an asset's price diverges from its historical average, it's likely to return to that average eventually. Traders often exploit this tendency by buying low and selling high as prices fluctuate within a range.
In contrast, in trending markets, the likelihood of mean reversion diminishes. In these regimes, prices exhibit a consistent, directional movement, either upward (bullish) or downward (bearish). During these phases, investors may observe prices moving away from their historical means without prompt corrections.
Consequently, in trending markets, traders usually adopt strategies that align with the trend, seeking to maximize gains from the price movement.
Recognizing these market distinctions is vital as it guides the selection of trading strategies and informs risk management decisions according to the current market regime.
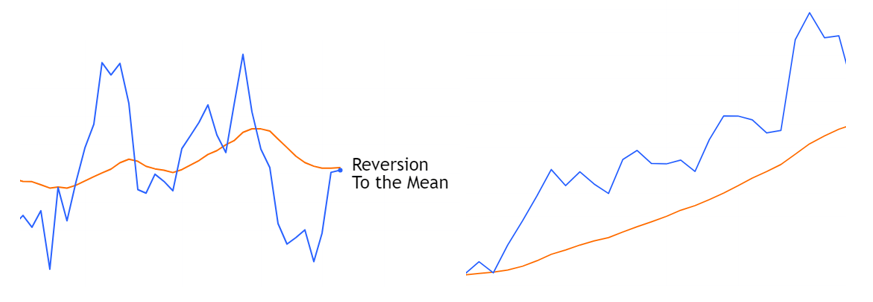
In the image on the left the price is ranging making it highly likely that it returns to the mean (average) whereas on the right the price is trending higher showing no indication of returning to the mean.
A brief look at statistics behind the concept of mean reversion
- Mean (Average): The mean is the average value of a dataset. It's calculated by adding up all the values and dividing by the number of data points. For example, if you have the numbers 1, 2, 3, 4, and 5, the mean is (1+2+3+4+5)/5 = 3.
- Standard Deviation: The standard deviation measures how spread out the data points are from the mean. A low standard deviation indicates that the data points are close to the mean, while a high standard deviation suggests that the data points are more spread out.
- Measuring mean reversion statistically: Augmented Dickey-Fuller (ADF) Test: The ADF test is a specific statistical test used to determine if a time series data set exhibits mean reversion. I will explain later in the article how systematic traders use this statistical tool to find markets to trade using a mean reversion trading strategy (or strategies).
How to create a mean reversion trading strategy?
Select the Right Market: To employ a mean reversion trading strategy, choose a market that is known for exhibiting mean reversion behaviour. This could include stocks, currency pairs, or commodities that historically oscillate around a moving average. Avoid the markets that have had strong trends recently.
Data Analysis: Analyse historical data to identify periods when the market demonstrates significant mean reversion tendencies and study price action in several timeframes during those periods. Look for periods when price ranges (reverts to the mean), as these periods can provide you with potential entry points.
Determine Timeframes: Decide on the timeframe that suits your trading strategy. Different timeframes may exhibit varying degrees of mean reversion. Shorter timeframes may provide more frequent but smaller opportunities, while longer timeframes may offer larger, albeit less frequent, opportunities.
Entry and Exit Rules: Develop clear and precise entry and exit rules for your mean reversion trading strategy. For example, you might enter a long position when the asset's price is below the mean and near to a support level and exit when it crosses above the mean (or alternatively rallies to the opposite end of the range). Conversely, enter a short position when the price is above the mean and near to a resistance level. Exit when the price falls below the mean or moves down to the lower end of the range. Ensure your rules include specific price thresholds or technical indicators.
Mean reversion trading strategy trade entry signals
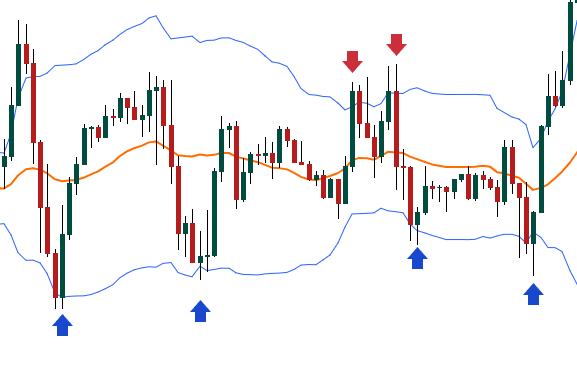
Bollinger Bands can be a systematic way to determine when to buy and sell during mean-reverting price action. Bollinger Bands serve as dynamic support and resistance levels in trading. When the price touches the lower band, it often indicates a potential long entry point, suggesting that the asset is oversold. Conversely, contact with the upper band may signal an opportunity for a short entry, implying the asset is overbought.
Traders using a mean reversion trading strategy should look for confirmation with a price reversal candlestick pattern near these bands. The mean line, typically a moving average, can act as an exit point or to assess trend strength. In the provided graph, the blue and red arrows highlight potential entry points.
Using Bollinger bands in a mean reversion trading strategy
Bollinger Bands, with their dynamic support and resistance levels, rely on statistics. They are typically set at 2 standard deviations (2 sd.) from the mean, encompassing about 95% of price data.
When the price touches the upper band, indicating overbought conditions, it suggests a potential short entry in our mean reversion trading strategy. Conversely, touching the lower band, signalling oversold conditions, may imply a long entry but you might want to look for a candlestick pattern to confirm these signals.
The bands adapt to market volatility, widening when it's high and contracting in calmer markets. In essence, Bollinger Bands offer statistically grounded guidance for traders, capturing the majority of price movements within the 2 sd. bands.
Risk Management: Implement robust risk management practices. This involves setting stop-loss orders to limit potential losses and not allocating too much capital to a single trade. Consider risk-reward ratios to ensure that potential profits outweigh potential losses.
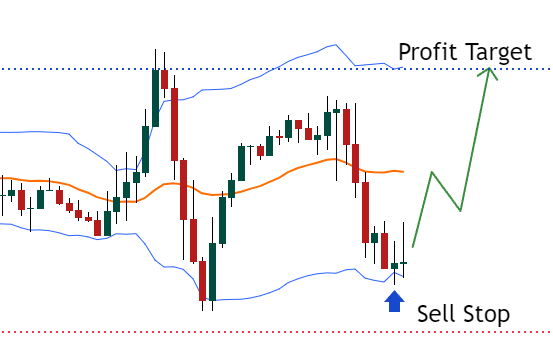
When trading a mean reversion trading strategy, profits are made in range-bound markets with profit targets relatively close to trade entries. Therefore, implementing robust risk management is crucial. This requires setting stop-loss orders just outside the range to cap potential losses if the price breaks out instead of reverting. Diversify capital across multiple trades to avoid excessive exposure on a single position.
Calculate risk-reward ratios for each trade, aiming for a minimum of 2:1 to ensure that the expected returns justify the risks taken. Continuously monitor the trades for potential range breaches and adjust stop-losses accordingly to protect capital. Discipline in adhering to these rules is key to long-term profitability.
Backtesting: Test your strategy using historical data to evaluate its effectiveness. This step helps you refine your entry and exit rules, as well as assess the strategy's overall performance under different market conditions.
Monitoring and Adaptation: Continuously monitor the market and your strategy's performance. Be prepared to adapt your strategy as market conditions change. Mean reversion may not always hold, so decide under what circumstances you will stop using the mean reversion trading strategy and use a trend following trading approach instead.
Psychological Discipline: Maintain emotional discipline. Trading based on mean reversion requires patience and adherence to your predefined rules. Emotional decisions can lead to costly mistakes.
Review and Improvement: Regularly review and improve your trading strategy. Keep a trading journal to document your trades and analyse what worked and what didn't. Make adjustments accordingly to enhance your strategy's performance over time.
By following these steps, you can create solid trading strategies that benefit from mean reversion with an aim to capitalize on price movements that tend to revert to their historical averages. Please remember, that no trading strategy is flawless; losses are inevitable. However, the key to successful trading isn't flawlessness but positive expectancy.
Mean reversion trading strategy with a positive expectancy
Positive expectancy means that over a series of trades, a strategy is expected to yield a net profit. It acknowledges that while individual trades may incur losses, the strategy's overall outcome is profitable. Traders focus on maximizing gains when they're right and minimizing losses when they're wrong. By maintaining a positive expectancy, even with occasional setbacks, traders can achieve consistent profitability over time, emphasizing the importance of a well-structured strategy and disciplined risk management rather than seeking perfection in every trade.
How can we know if a market is suitable for a mean reversion trading strategy?
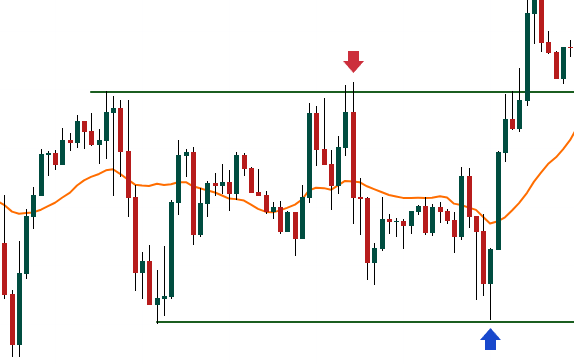
Technical analysis: To identify markets suitable for a mean reversion strategy, traders can observe the behaviour of Simple Moving Averages (SMA) with periods of 20 and 30. When both SMAs move sideways and roughly in the middle of the recent price range, it indicates a ranging market.
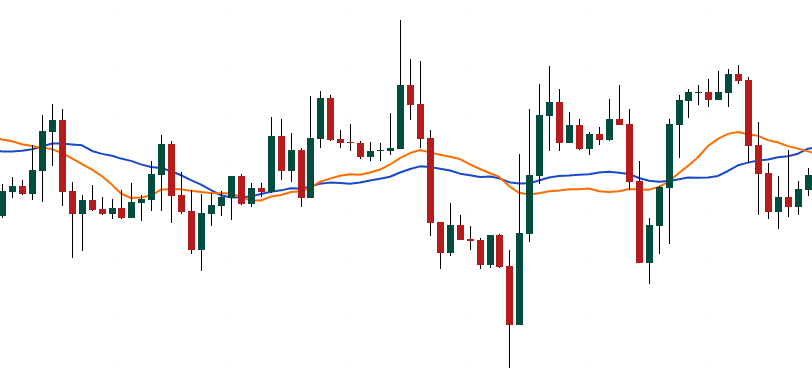
In this context, ranging means that prices are fluctuating within a defined range without a clear trend. Traders recognize this as an opportunity for mean reversion strategies. They can buy near the lower end and sell near the upper end of the range, anticipating price reversals to the mean. However, caution is essential as ranging markets can transition into trends, requiring strategy adjustments as market conditions evolve.
Statistical analysis: To determine if a market is statistically prone to mean reversion behaviour and suitable for a mean reversion trading strategy, a trader can follow a concise process. First, apply the Augmented Dickey-Fuller (ADF) test to the market's price or asset data.
Focus on the test statistic and p-value: a highly negative test statistic and a low p-value suggest stronger mean reversion tendencies. You can use for instance Chat GPT 4 to perform this test provided you have the price data for the market you are looking to analyse.
How is mean reversion tendency measured statistically?
The Augmented Dickey-Fuller (ADF) test, a tool for evaluating mean reversion, examines if a dataset, such as stock indices or forex pairs, typically returns to its average value. We applied this test to both the NASDAQ index and the EURGBP pair, assessing their tendencies to revert to their averages.
The test's null hypothesis suggests that such series are non-stationary, lacking a stable mean and variance, indicating that they may follow persistent trends instead of oscillating around a consistent average. The tests were carried out by using Chat GPT-4 and daily data from Tradingview so that you are better equipped to choose the markets in which apply a mean reversion trading strategy.

In a study covering the period from 1st January 2017 onwards, we applied the Augmented Dickey-Fuller (ADF) test to the NASDAQ index to assess its tendency towards mean reversion. The results revealed a test statistic of -0.397, which is higher than the critical values at the 1% (-3.4341), 5% (-2.8632), and 10% (-2.5676) significance levels.
This indicates the failure to reject the null hypothesis of a unit root, suggesting that the Nasdaq index is non-stationary.
Therefore, based on this analysis, the NASDAQ index does not exhibit mean-reverting behaviour in the examined timeframe. Visual observation of the daily NASDAQ index chart above confirms the statistical study as we can see how NASDAQ index chart tends to trend more than the EURGBP chart below.

In the analysis of the EURGBP currency pair for the period starting from 1st January 2017, the Augmented Dickey-Fuller (ADF) test yielded a test statistic of -3.992, significantly more negative compared to the Nasdaq index's result. The p-value was found to be 0.00145, substantially lower than that of the Nasdaq.
These results, particularly the test statistic being lower than the critical value at the 1% level (-3.4339), indicate a rejection of the null hypothesis of a unit root. This suggests that the EURGBP currency pair is stationary and therefore exhibits a higher likelihood of mean reversion. Therefore, EURGBP is probably a better market to use a mean reversion trading strategy in.
Exploring mean reversion with the ADF test
Consequently, it shows a greater tendency to revert to its average value over time in this study period, compared to the Nasdaq index. It is imperative to emphasize that while the ADF test provides valuable insights into mean reversion, it is just one of many tools employed in financial analysis. Interpretation should be approached with caution, considering the broader context and incorporating additional analytical techniques to form a comprehensive understanding of market behaviour.
Implications of our study for mean reversion trading strategies
For traders considering a mean reversion trading strategy, where the aim is to profit from prices returning to their average, our analysis offers valuable insights. The NASDAQ, with its high p-value from the Augmented Dickey-Fuller test, shows little tendency towards mean reversion.
This implies that a mean reversion strategy might not be as effective in the NASDAQ market, as prices do not regularly return to an average value. On the other hand, the EURGBP currency pair, with a significantly lower p-value, indicates a stronger inclination towards mean reversion.
Therefore, traders looking to apply a mean reversion strategy might find more potential opportunities in trading EURGBP compared to the NASDAQ.
Mean reversion trading strategy during different market regimes
Therefore, mean reversion trading strategies can be particularly effective in markets where price movements exhibit cyclical or oscillating patterns. However, as discussed before, the effectiveness of mean reversion strategies significantly varies across different market regimes.
It therefore follows that we could improve our hit rate by trading the markets that are prone to mean reverting behaviour and use our mean reversion trading strategy only when the market in question is in a range bound mode.
During stable or range-bound markets, mean reversion strategies often perform well as prices fluctuate within a predictable range, reverting back to a mean value after reaching overbought or oversold levels.
Conversely, in trending or volatile markets, where prices move strongly in one direction, mean reversion strategies may be less effective. In these conditions, prices may not revert to the mean quickly or reliably, leading to potential losses.
Choosing currency pairs for trading a mean reversion trading strategy
Traders employing a mean reversion trading strategy may prefer cross currency pairs over USD pairs due to several advantages. Cross currency pairs, such as EURGBP or GBPCAD, often exhibit stronger mean-reverting tendencies as they are less influenced by the US dollar's dominant role in global markets.
Traders may find other FX pairs e.g. USD pairs, are likely to move in trends due to several factors. Economic divergence, as seen in for instance GBPUSD, involves distinct economic cycles, interest rates, and inflation rates between the UK and the US, leading to higher volatility.
Geopolitical factors unique to the UK and the US, including politics, trade, and global events, can introduce added volatility. Additionally, the US dollar's safe-haven status can lead to sharp movements in GBPUSD during uncertain times. Differing market participants in these pairs may also contribute to greater price swings, making cross currency pairs potentially more suitable for mean reversion strategies.
In conclusion
As you start your journey to explore mean reversion trading strategies and navigate the complexities of financial markets, it's important to have the right platform to execute your trades. At TIOmarkets, we understand the significance of effective trading tools and support for traders of all levels.
Whether you're a seasoned investor or just starting, our user-friendly platform provides the resources and features you need. To get started on your path to success with mean reversion trading, simply visit our account opening page to open your trading account with us.
To help you on your journey towards crafting your own mean reversion trading strategy, this article combines statistical theory with practical trading tools like Bollinger Bands. It's crucial for traders to understand that success in this endeavor goes beyond mere theory; it requires a holistic approach that includes market selection, technical and statistical tools, as well as disciplined risk management and psychological control.
One key takeaway for traders is the need for discernment in market selection and the strategic utilization of tools like Bollinger Bands and the Augmented Dickey-Fuller test. These tools aren't just accessories in a trader's toolkit; they are indispensable for identifying markets suited to this strategy and refining your trading techniques for optimal results.
Remember that a successful mean reversion trading strategy goes beyond the 'set-and-forget' approach. It requires continuous adaptation and a profound understanding of market intricacies. Join our thriving community of traders today and experience the difference with TIOmarkets. To embark on this journey, simply visit our account opening page and begin your path to success in mean reversion trading.

Risk disclaimer: CFDs are complex instruments and come with a high risk of losing money rapidly due to leverage. You should consider whether you understand how CFDs work and whether you can afford to take the high risk of losing your money. Never deposit more than you are prepared to lose. Professional client’s losses can exceed their deposit. Please see our risk warning policy and seek independent professional advice if you do not fully understand. This information is not directed or intended for distribution to or use by residents of certain countries/jurisdictions including, but not limited to, USA & OFAC. The Company holds the right to alter the aforementioned list of countries at its own discretion.

Janne Muta holds an M.Sc in finance and has over 20 years experience in analysing and trading the financial markets.
Related Posts


Trade responsibly: CFDs are complex instruments and come with a high risk of losing all your invested capital due to leverage.