Perdagangan Berjangka
Perdagangan atau lindung nilai risiko tanpa biaya swap
Berdagang itu berisiko.
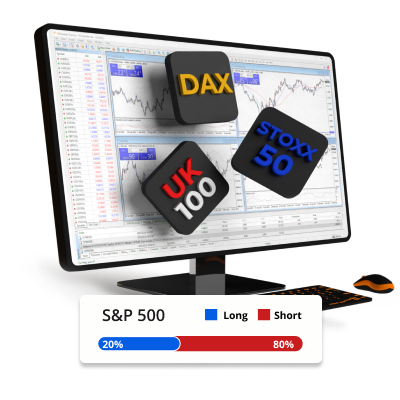
INDEKS DARI
US, INGGRIS RAYA, UNI EROPA & ASIA
DARI PERDAGANGAN
$0 KOMISI
HINGGA
1: PENGUNGKIT 100 KALI
4 KONTRAK BERJANGKA
INDEKS DARI
US, INGGRIS RAYA, UNI EROPA & ASIA
DARI PERDAGANGAN
$0 KOMISI
HINGGA
1: PENGUNGKIT 100 KALI
4 KONTRAK BERJANGKA
Memperdagangkan pasar berjangka
Simbol
Penawaran
Bertanya
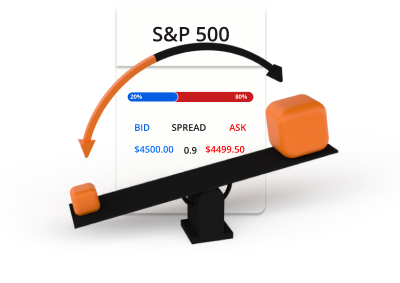
Menyebar

*Harga-harga di halaman ini bersifat indikatif. Harga-harga untuk instrumen dengan likuiditas lebih rendah seperti pasangan mata uang eksotis, saham, dan indeks tidak diperbarui se sering instrumen yang umum diperdagangkan. Silakan periksa di dalam platform MT4/MT5 Anda untuk harga live terbaru.
Apa itu Futures
Futures adalah kontrak derivatif yang mewajibkan pihak-pihak yang terlibat untuk membeli atau menjual suatu aset pada tanggal yang telah ditentukan di masa depan dengan harga tertentu. Harga berasal dari aset acuan dan sifat kontrak ini membuat kontrak ini berguna untuk perdagangan dan lindung nilai. Kontrak berjangka memiliki tanggal kedaluwarsa dan tidak ada biaya swap semalam, sehingga sangat hemat biaya untuk perdagangan jangka panjang.

Tidak ada pertukaran semalam

Bagus untuk lindung nilai

Berdagang dengan Leverage
Cara kerja perdagangan berjangka
Perdagangan berjangka bekerja mirip dengan perdagangan CFD, tetapi setiap kontrak berjangka memiliki tanggal kedaluwarsa. Anda dapat menutup posisi Anda kapan saja atau membiarkan kontrak ditutup pada saat kedaluwarsa. Jika Anda ingin mempertahankan posisi Anda setelah tanggal kedaluwarsa, Anda dapat membuka posisi baru dalam kontrak berjangka dengan tanggal kedaluwarsa yang lebih lama. Kontrak berjangka sering diperbarui dengan tanggal kedaluwarsa yang baru dan tanggal kedaluwarsa untuk setiap kontrak berjangka ditunjukkan dengan akhiran simbol. Contohnya, DJ.H24 adalah kontrak berjangka Dow Jones yang akan berakhir pada Maret 2024. SP.N24 adalah kontrak berjangka S&P 500 yang berakhir pada Juli 2024.
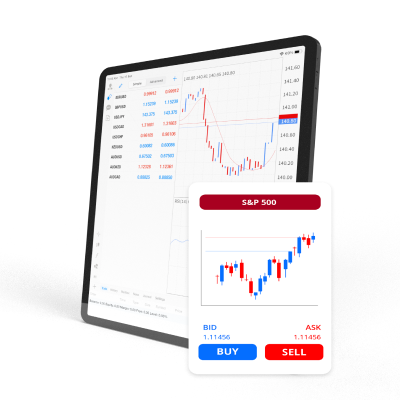
Harga penawaran dan permintaan
Ambil posisi beli atau jual

Kontrak berjangka diperdagangkan dalam lot
Perdagangan berjangka melibatkan leverage dan margin
Contoh perdagangan berjangka
Anda memutuskan untuk membeli 0,1 lot S&P500 futures pada harga 4.500 dengan leverage 100:1.

5 kontrak berjangka x 4.500 = USD 22.250
USD 22,250
USD 22,250 / 100 = USD 225
Sekarang Anda telah membuka posisi long pada S&P500 senilai USD 22.250. Karena futures diperdagangkan menggunakan leverage, hanya $225 yang digunakan sebagai margin dari akun trading Anda. Setelah beberapa waktu, harga S&P500 bergerak dan Anda memutuskan untuk menjual.
Skenario 1

S&P500 bergerak naik dari 4.500 ke 4.600 dan Anda memutuskan untuk menjual.
Dengan cara inilah keuntungan atau kerugian dari perdagangan akan dihitung.
K/K = (Harga saat ini - Harga awal) x Nilai posisi / Harga saat ini
K/K = ((4600 - 4500) × 22,250) / 4,600
K/K = (100 × 22,250) / 4,600
K/K= 483.70
Skenario 2

S&P500 bergerak turun dari 4.500 ke 4.400 dan Anda memutuskan untuk menjual.
Dengan cara inilah keuntungan atau kerugian dari perdagangan akan dihitung.
K/K = (Harga saat ini - Harga awal) x Nilai posisi / Harga saat ini
K/K = ((4400 - 4500) × 22,250) / 4,400
K/K = (-100 × 22,250) / 4,600
K/K = -483.70
Mengapa TIOmarkets
Inilah alasan orang seperti Anda memilih TIOmarkets

Spreads mulai dari 0.0 pips
Trading dengan spread variabel kasar pada akun Raw

Trading tanpa komisi
Trading dari $0 per lot di akun VIP Black atau Standard kami

Platform Perdagangan
Platform trading canggih untuk desktop, web, dan seluler

Eksekusi order cepat
Pemrosesan order yang efisien dan andal dalam hitungan milidetik

Leverage tak terbatas
Trading dengan leverage hingga tidak terbatas pada akun Standard

Bonus Loyalti 30%
Dapatkan bonus setiap deposit ke akun Standard kami
Trading di platform MT4 atau MT5
Dari desktop, browser internet, atau perangkat seluler

MT5 adalah platform perdagangan multi-aset yang mencakup semua yang Anda temukan di MT4. Ditambah kemampuan dan alat analisis teknis yang lebih banyak dibandingkan pendahulunya. Termasuk lebih banyak jenis pesanan dan kalender ekonomi bawaan.
Tersedia untuk:


Mulai trading dalam hitungan menit
Beginilah cara kerjanya

LANGKAH 1
Daftar
Lengkapi profil Anda dan buat akun Anda, hanya butuh beberapa menit

LANGKAH 2
Memeriksa
Unggah bukti identitas dan alamat Anda; ini wajib sebelum penarikan

LANGKAH 3
Dana
Pilih dari metode lokal dan internasional yang praktis dan setor secara instan

LANGKAH 4
Trading
Unduh platformnya, transfer dana ke akun Anda, login, dan mulai trading
Berdagang itu berisiko.