FTSE 100 Technical Analysis | UK CPI expected to decrease to 3.8%
BY Janne Muta
|gennaio 16, 2024FTSE 100 technical analysis - The UK Consumer Price Index (CPI) release for December 2023 is due tomorrow. Economists anticipate a slight easing of inflation, with predictions suggesting the CPI will be 3.8% higher than a year ago, marking a decrease from November 2023's rate of 3.9%. The core CPI rate is also expected to ease to 4.9% from 5.1%.
There is a general expectation that the Bank of England might consider cutting interest rates as economists forecast that CPI will fall below the Bank's 2% target sooner than previously anticipated, allowing for a potential reduction in interest rates. It's projected that a significant decrease in energy bills in the spring could lead to a quicker return to the target inflation rate, potentially pushing CPI slightly below 2% in April and May.
These predictions indicate a potentially more positive outlook for the UK economy, with the likelihood of stronger growth in real household incomes and GDP. The Bank of England is expected to lower its inflation forecasts in the February Monetary Policy Report, laying the groundwork for potential rate cuts. This should be positive for the UK equities.
Summary of This FTSE 100 Technical Analysis Report:
- FTSE 100 has traded down to a market structure level at 7542 which is closely aligned with the SMA(20). This level is a potential support and if the level attracts buyers and the market reverses at or near the level, look for a move to 7655 and then possibly to the December high at 7765.
- Alternatively, below 7542 the market could move down to 7460. Moving averages-based FTSE 100 technical analysis shows the market in a sideways trend as the moving averages are moving sideways and are roughly in the middle of the recent price range.
Read the full FTSE 100 technical analysis report below.
FTSE 100 technical analysis
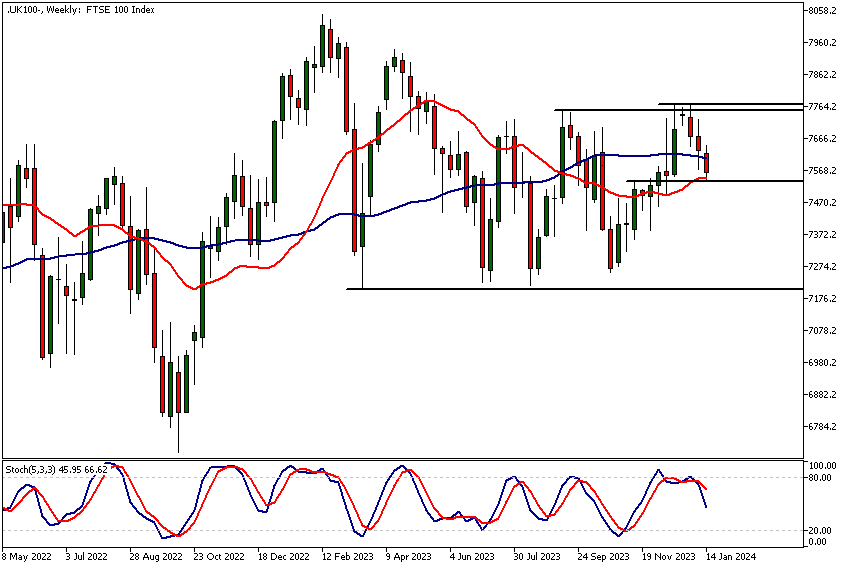
Weekly FTSE 100 technical analysis
FTSE 100 has traded down to a market structure level at 7542 which is closely aligned with the SMA(20). This level is a potential support and if the level attracts buyers and the market reverses at or near the level, look for a move to 7655 and then possibly to the December high at 7765.
Alternatively, below 7542 the market could move down to 7460. Moving averages-based FTSE 100 technical analysis shows the market in a sideways trend as the moving averages are moving sideways and are roughly in the middle of the recent price range.
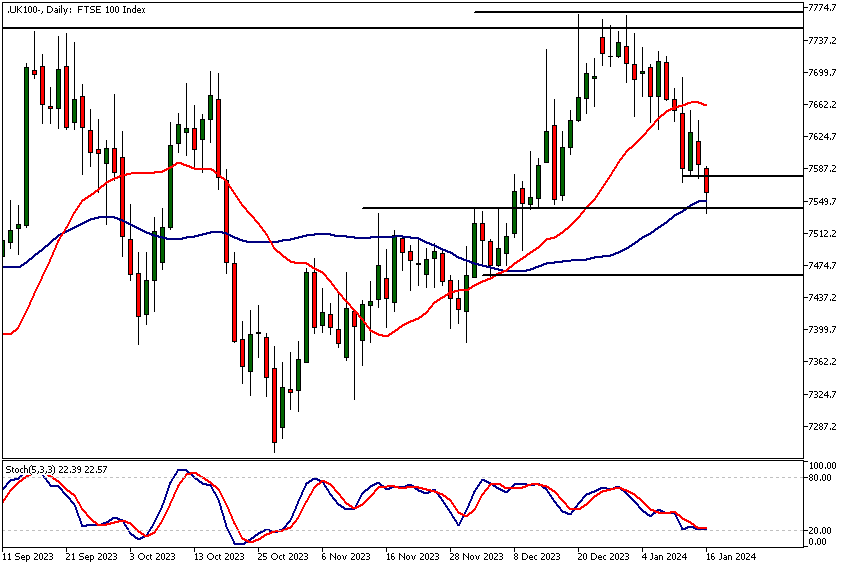
Daily FTSE 100 technical analysis
The daily chart shows the FTSE 100 reacting to the 7534 level and the SMA(50) that is closely aligned with it. This however is only a reaction not a market reversal at the time of writing this. The nearest key resistance level at 7578 is relatively close by increasing the risk of potential rally failure.
If there was a decisive break above 7590, we could see the market reaching the levels mentioned in the weekly FTSE 100 technical analysis section above. As the current daily momentum is bearish we need to consider the possibility that the market could be likely to move lower before it is ready to rally again. If the 7534 level doesn't hold and selling continues below the level, the nearest support level at 7492 could come into play.
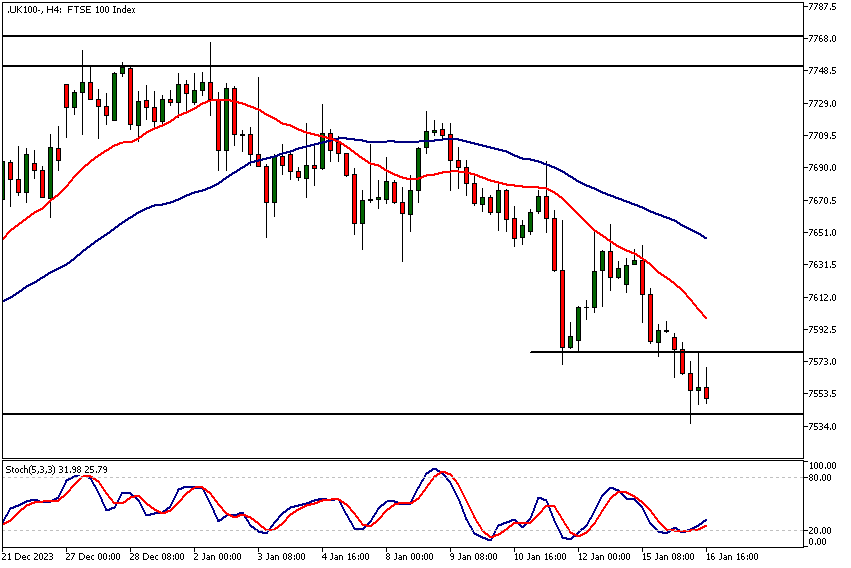
Intraday FTSE 100 technical analysis
In the 4h timeframe, the FTSE 100 is in a bearish trend with the moving averages pointing lower and the fast SMA(20) below the slow SMA(50). The market has tested the 7578 resistance level and created a bearish rejection candle. This indicates trend continuation.
The stochastic oscillator is moving higher from oversold levels indicating a loss in downside momentum. The market would need to however break above the 7578 for confirmation of this indication.
The next key risk events impacting this market
- CPI y/y
- WEF Annual Meetings
- Retail Sales m/m
- WEF Annual Meetings

Potential FTSE 100 Market Moves
If the 7542 level attracts buyers and the market reverses at or near the level, look for a move to 7655 and then possibly to the December high at 7765. Alternatively, below 7542 the market could move down to 7460.
How Would You Trade the FTSE 100 Today?
I hope this FTSE 100 technical analysis helps you to make better informed trading decisions. Check the latest market analysis for other instruments and subscribe to receive them in your inbox as soon as they are published
DISCLAIMER: TIO Markets offers an exclusively execution-only service. The views expressed are for information purposes only. None of the content provided constitutes any form of investment advice. The comments are made available purely for educational and marketing purposes and do NOT constitute advice or investment recommendation (and should not be considered as such) and do not in any way constitute an invitation to acquire any financial instrument or product. TIOmarkets and its affiliates and consultants are not liable for any damages that may be caused by individual comments or statements by TIOmarkets analysis and assumes no liability with respect to the completeness and correctness of the content presented. The investor is solely responsible for the risk of his/her investment decisions. The analyses and comments presented do not include any consideration of your personal investment objectives, financial circumstances, or needs. The content has not been prepared in accordance with any legal requirements for financial analysis and must, therefore, be viewed by the reader as marketing information. TIOmarkets prohibits duplication or publication without explicit approval.

Janne Muta holds an M.Sc in finance and has over 20 years experience in analysing and trading the financial markets.
Related Posts


Trade responsibly: CFDs are complex instruments and come with a high risk of losing all your invested capital due to leverage.