GBPUSD Technical Analysis | UK economy sees strongest growth in 5 months
BY Janne Muta
|gennaio 12, 2024GBPUSD Technical Analysis - Today's GDP release indicates the strongest growth in five months for the UK economy, with actual month-on-month growth at 0.3%, surpassing expectations of 0.2% and rebounding from the previous decline of -0.3%. Despite outdoing the forecasted 0.2% growth, the economy experienced a contraction of 0.2% over the past three months, hinting at an underlying weakness.
This monthly uptick is largely attributed to the service sector's robust performance, which saw a 0.4% increase, and the industrial sector, including manufacturing, which both rose by 0.3%. These figures suggest a resilient productive backbone, echoing the modest recovery signalled by recent PMI data. However, the construction sector dipped by 0.2%, indicating sector-specific challenges.
Economic growth in the UK has been slow due to the highest BoE interest rates in over a decade and soaring inflation. This has squeezed households throughout 2023 but prospects for 2024 appear somewhat brighter. Economists are predicting a revival fuelled by decreasing inflation, declining mortgage rates, and the potential for increased real disposable income, bolstered by government tax cuts.
Yesterday the US CPI showed a 0.3% monthly rise in headline and core metrics. Core CPI year-over-year hit 3.9%, above the 3.8% prediction, and headline CPI reached 3.4%, surpassing the 3.2% forecast. Shelter costs increased by 0.4%. Fed officials emphasised the importance of approaching the 2% inflation target, expressing caution in policy adjustments, focusing on housing inflation and data reliance for future interest rate decisions.
Summary of This GBPUSD Technical Analysis Report:
- The GBPUSD pair witnessed a rally after attracting buyers at 1.2610, complemented by a bullish rejection candle, indicating potential strength for the upcoming weeks. However, surpassing the previous week's high remains crucial for confirmation. Recent wedging might have contributed to the sluggish performance observed in the last two weeks.
- GBPUSD, after breaking below an ascending channel, has entered a sideways range between 1.2686 and 1.2770, indicating hesitation in a sell-off and an attempt to continue the uptrend. The market's direction hinges on the 1.2686 support level; holding it suggests a move towards 1.2828 - 1.2860, while breaking it could lead to 1.2600.
- On the 4-hour chart, GBPUSD shows a slight upward bias with a higher reactionary low at 1.2690. A new higher swing low above this level could increase the likelihood of hitting the upside targets detailed in the daily analysis. The market's current range mode is reflected in the moving averages showing limited momentum.
Read the full GBPUSD technical analysis report below.
GBPUSD technical analysis
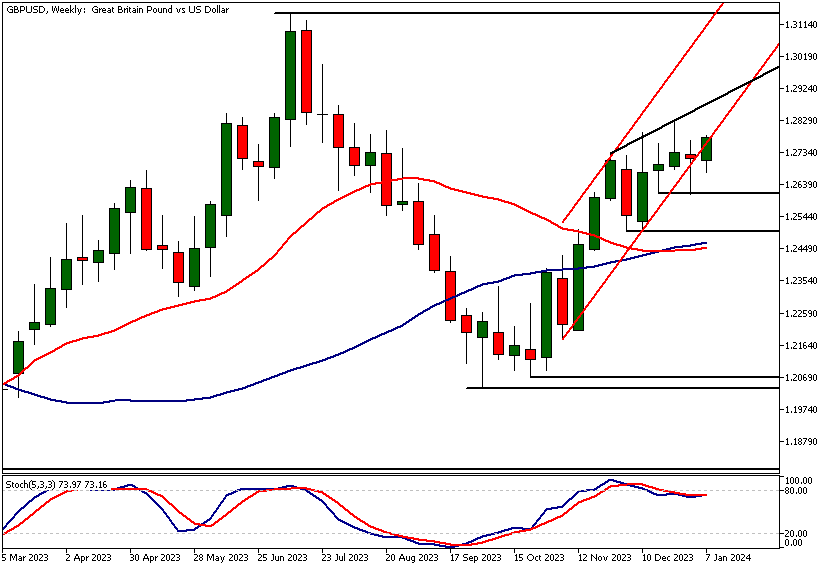
Weekly GBPUSD technical analysis
The GBPUSD pair has rallied after finding buyers at 1.2610 last week. Moreover, the market formed a bullish rejection candle, signalling strength for this and the upcoming week. However, a decisive rally above the previous week's high is necessary to confirm this trend. Our GBPUSD technical analysis suggests the recent wedging may have contributed to its sluggish performance over the past fortnight.
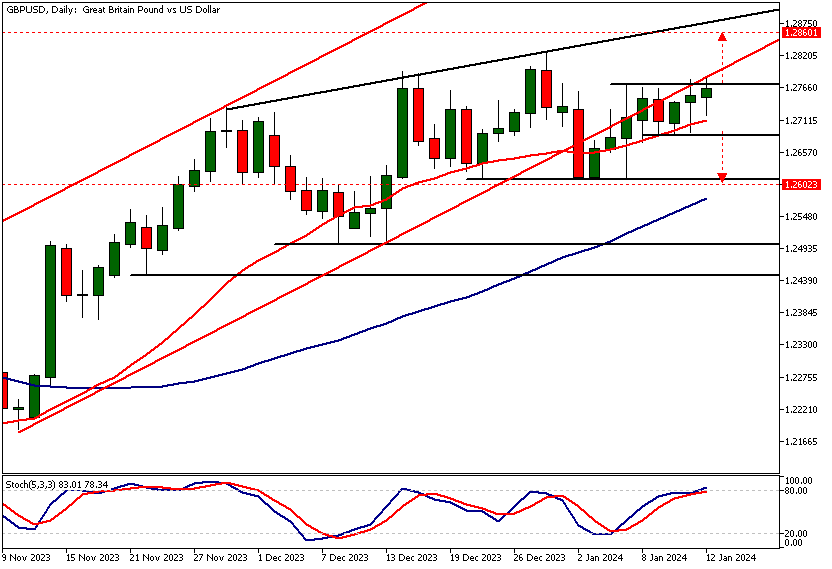
Daily GBPUSD technical analysis
Following a break below an ascending trend channel, the market experienced a modest rally but failed to re-enter the channel. Instead, GBPUSD has been trading within a sideways range between 1.2686 and 1.2770. The market, seemingly not ready for a sell-off, is attempting to resume the uptrend.
Should the 1.2686 support level hold, we might see Cable trading within the 1.2828 - 1.2860 range. Conversely, a fall below 1.2686 could lead to a move towards 1.2600. These targets are based on measured move projections, utilising the width of the current sideways range.
Moving averages based GBPUSD technical analysis indicate bullishness, with the moving averages trending upwards and the SMA(20) positioned above the SMA(50).
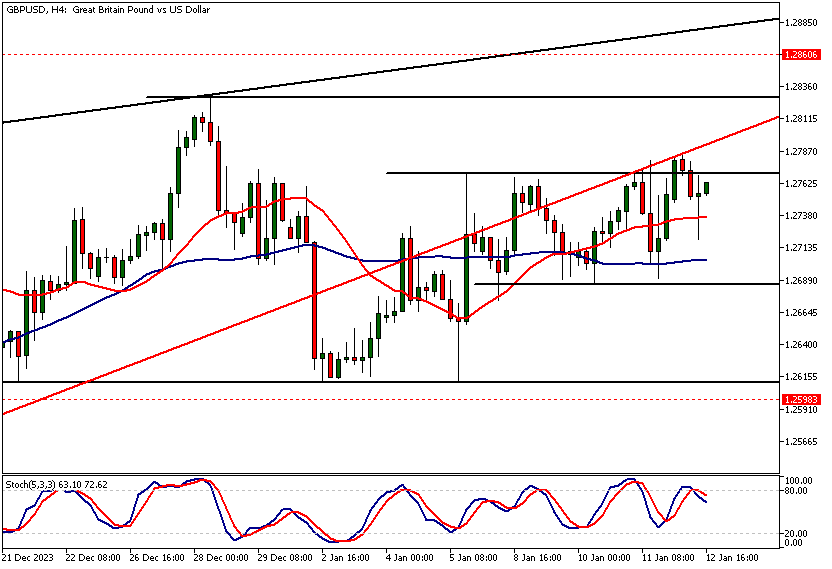
Intraday GBPUSD technical analysis
The 4-hour chart shows a slight upward bias, with the market establishing a higher reactionary low at 1.2690. If GBPUSD forms another higher swing low above this mark, the likelihood of reaching the upside targets (as outlined in the daily GBPUSD technical analysis above) increases.
The market has formed a bullish rejection candle that could signify a higher swing low if the candle's high is surpassed. Concurrently, moving averages show a lack of momentum, aligning with the market's current ranging mode.
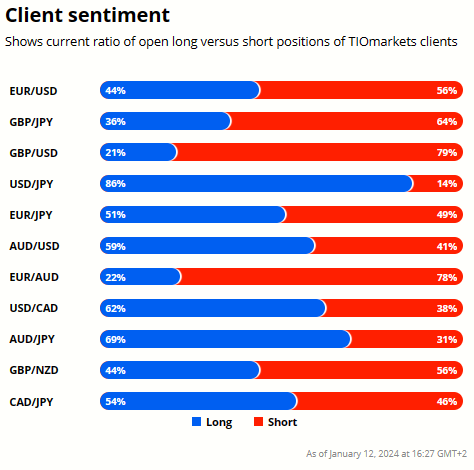
Client sentiment analysis
21% of clients trading GBPUSD are holding long positions, while 79% are holding short positions. Client sentiment data is being provided by TIO Markets Ltd.
It’s good to remember that retail client trading sentiment is a contrarian indicator as most retail traders are on average trading against market price trends. This is why experienced traders tend to trade against the retail client sentiment. You can follow the TIOmarkets client sentiment live on our Forex dashboard.
The next key risk events impacting this market
- GBP - Claimant Count Change
- GBP - Average Earnings Index 3m/y
- USD - Empire State Manufacturing Index
- GBP - CPI y/y
- USD - Core Retail Sales m/m
- USD - Retail Sales m/m
- USD - Industrial Production m/m
- USD - Unemployment Claims
- USD - Building Permits
- USD - Philly Fed Manufacturing Index
- GBP - Retail Sales m/m
- USD - Prelim UoM Consumer Sentiment
- USD - Existing Home Sales
Potential GBPUSD Market Moves
In a bullish scenario, GBPUSD could continue its uptrend, especially if the 1.2686 support holds, potentially reaching as high as 1.2828 - 1.2860. Alternatively, a break below the 1.2686 level could trigger a decline towards 1.2600, reflecting a shift in market sentiment and momentum.

How Would You Trade GBPUSD Today?
I hope this GBPUSD technical analysis helps you to make better informed trading decisions. Check the latest market analysis for other instruments and subscribe to receive them in your inbox as soon as they are published
DISCLAIMER: TIO Markets offers an exclusively execution-only service. The views expressed are for information purposes only. None of the content provided constitutes any form of investment advice. The comments are made available purely for educational and marketing purposes and do NOT constitute advice or investment recommendation (and should not be considered as such) and do not in any way constitute an invitation to acquire any financial instrument or product. TIOmarkets and its affiliates and consultants are not liable for any damages that may be caused by individual comments or statements by TIOmarkets analysis and assumes no liability with respect to the completeness and correctness of the content presented. The investor is solely responsible for the risk of his/her investment decisions. The analyses and comments presented do not include any consideration of your personal investment objectives, financial circumstances, or needs. The content has not been prepared in accordance with any legal requirements for financial analysis and must, therefore, be viewed by the reader as marketing information. TIOmarkets prohibits duplication or publication without explicit approval.

Janne Muta holds an M.Sc in finance and has over 20 years experience in analysing and trading the financial markets.
Related Posts


Trade responsibly: CFDs are complex instruments and come with a high risk of losing all your invested capital due to leverage.