Gold Technical Analysis | Rising dollar poses a risk to XAUUSD
BY Janne Muta
|gennaio 16, 2024Gold Technical Analysis - In the next few days, the T-bond market may see weakness based on our technical analysis in the daily and weekly charts. This would lead to increasing yields which the dollar traders seem to have picked as the US Dollar Index has been on the rise for three consecutive days.
This could lead to a corrective move in the gold market. Meanwhile, Fed Funds futures traders predict the terminal rate for this year to be between 375 and 400 basis points, implying six 25 basis point rate cuts by year-end. There's a 69% chance the first cut will be in March.
December 2023 saw US inflation climb to 3.4% annually, surpassing expectations, mainly due to rising housing and energy costs. Despite a 0.3% overall price increase from November, core inflation (excluding food and energy) remained at 0.3% monthly, reaching a yearly high of 3.9%—the lowest since May 2021. While inflation has reduced from its mid-2022 peak of 9.1%, public discontent with the economy persists, a hangover from previous high inflation rates.
Simultaneously, the gold market pricing may be influenced by safe-haven demand, particularly if the ongoing Middle East crisis continues to escalate across the region. In the most recent escalation, Iran launched missile attacks on Iraq, citing their intent to target what they referred to as the Israeli "spy headquarters" located in Northern Iraq.
Summary of This Gold Technical Analysis Report:
- Gold created a bullish rejection candle last week, indicating potential upside. If XAUUSD surpasses 2062, a rise to 2088 is possible, while a drop below 2013 might lead to 1980. Technical analysis shows long-term bullishness with upward trending moving averages.
- Gold has formed a double bottom at 2013 in the daily chart, aligning with SMA(50). With rising SMA(20) and SMA(50), the double bottom suggests bullishness above 2013. Resistance at 2058 - 2064 could lead to 2088 if broken, but a decline might take the market to 2024.
- Intraday gold trades at the 2042 support level. Falling below 2042 could lead to a drop to 2024 and then perhaps to 2013. If the 2042 support holds, look for a move to 2062.
Read the full gold technical analysis report below.
Gold Technical Analysis
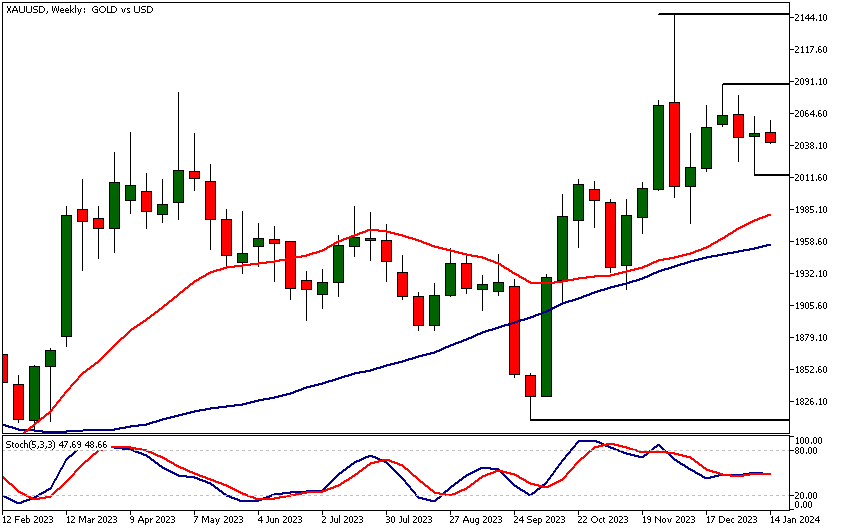
Weekly Gold Technical Analysis
Last week gold created a bullish rejection giving early indications of further upside potential but the lower weekly reactionary high at 2088 is a risk for the bulls. If XAUUSD can rally decisively above last week's high (2062) a move to 2088 could be likely. Alternatively, a retest of last week's low at 2013 might occur.
Below 2013 the market might trade down to 1980. Indicator-oriented gold technical analysis suggests continued long-term bullishness with the moving averages pointing higher and the fast SMA(20) above the slow SMA(50).
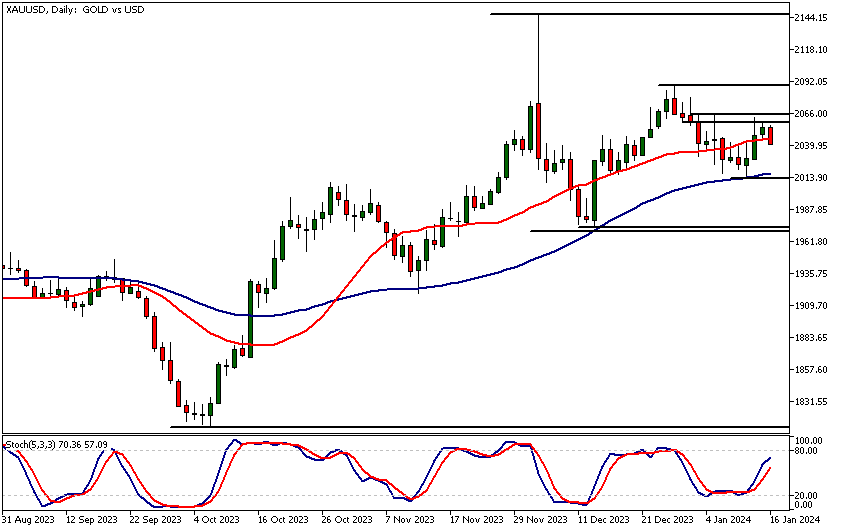
Daily Gold Technical Analysis
Gold double bottomed at 2013, a level closely aligning with the SMA(50). Both moving averages SMA(20) and SMA(50) point higher with the fast SMA above the slow. The rally higher from the 2013 support level confirms the bullish indication given by the moving averages.
However, the rally lost steam after moving to a minor market structure area at 2058 - 2064. Look for a move to 2088 if this area can be penetrated decisively. Alternatively, our gold technical analysis shows that a move down to 2024 could be likely.
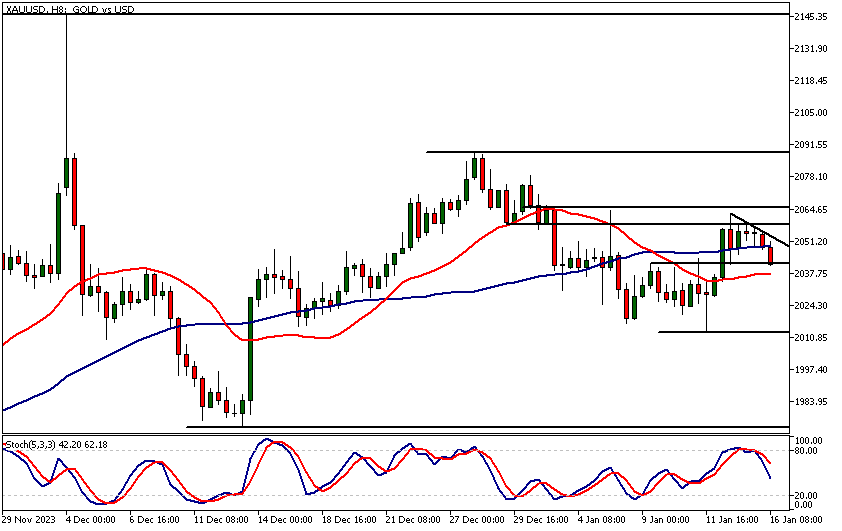
Intraday Gold Technical Analysis
The market is trading at the 2042 support level. If the level holds and there is a decisive move higher from 2042 we could see the market breaking above the descending trend line resistance.
This would increase the probability of the gold market breaking above the market structure area at 2058 - 2064 we referred to in the daily gold technical analysis section above. Alternatively, a break below the 2042 level might lead the market down to 2024 and then possibly to 2013.
The stochastic oscillator points lower after giving a sell signal. This reflects the loss of momentum seen in the market yesterday. Note however, that yesterday was Martin Luther King Day in the US and with most of the markets more quiet than usual it was not a surprise to see the gold market moving sideways below Friday's high.
The next key risk events impacting this market:
- USD - Empire State Manufacturing Index
- USD - WEF Annual Meetings
- USD - Core Retail Sales m/m
- USD - Retail Sales m/m
- USD - Industrial Production m/m
- USD - Unemployment Claims
- USD - Building Permits
- USD - Philly Fed Manufacturing Index
- USD - Prelim UoM Consumer Sentiment
- USD - Existing Home Sales
- USD - Prelim UoM Inflation Expectations
Potential Gold Market Moves
Gold's bullish scenario involves surpassing 2062, potentially reaching 2088, bolstered by upward-trending moving averages. The bearish alternative entails a decline down to 2013 if the 2042 support level breaks.

How Would You Trade Gold Today?
I hope this Gold technical analysis helps you to make better informed trading decisions. Check the latest market analysis for other instruments and subscribe to receive them in your inbox as soon as they are published
DISCLAIMER: TIO Markets offers an exclusively execution-only service. The views expressed are for information purposes only. None of the content provided constitutes any form of investment advice. The comments are made available purely for educational and marketing purposes and do NOT constitute advice or investment recommendation (and should not be considered as such) and do not in any way constitute an invitation to acquire any financial instrument or product. TIOmarkets and its affiliates and consultants are not liable for any damages that may be caused by individual comments or statements by TIOmarkets analysis and assumes no liability with respect to the completeness and correctness of the content presented. The investor is solely responsible for the risk of his/her investment decisions. The analyses and comments presented do not include any consideration of your personal investment objectives, financial circumstances, or needs. The content has not been prepared in accordance with any legal requirements for financial analysis and must, therefore, be viewed by the reader as marketing information. TIOmarkets prohibits duplication or publication without explicit approval.

Janne Muta holds an M.Sc in finance and has over 20 years experience in analysing and trading the financial markets.
Related Posts


Trade responsibly: CFDs are complex instruments and come with a high risk of losing all your invested capital due to leverage.