Natural Gas Technical Analysis | Record high demand but no market reaction
BY Janne Muta
|gennaio 17, 2024Natural gas technical analysis - Natural gas has failed to rally higher even though a record-high US natural gas demand is reported due to extreme cold, with supplies at a 13-month low. Arctic conditions disrupted oil and gas operations, including a Texas refinery shutdown.
The Texas power grid operator, ERCOT, met unprecedented demand, surpassing the previous winter record. Other grid operators extended cold weather advisories. US gas production dropped significantly, but a substantial recovery was expected. ERCOT avoided emergency measures through conservation efforts, and Atmos Energy urged customers in Texas and Mississippi to conserve gas amidst the high demand and challenging weather conditions.
Summary of This Natural gas Technical Analysis Report:
- Natural gas trading lower, back inside the reversal formation from three weeks ago. Traders should watch daily and intraday charts for potential bounce or further decline, with resistance at 3.011 and November low at 2.193 as a key level.
- Market dropped below the 2.510 support, hovering close enough to potentially bounce back. Resistance near 2.618 may deter bulls. Technical indicators show mixed signals, with SMA(50) pointing down, SMA(20) rising, and a stochastic oscillator in the oversold zone without a buy signal yet.
- Intraday analysis on the 8h chart shows a challenging market structure area for bulls between 2.596 and 2.618. A move down to 2.367 is possible if there's no upward reaction. Indicators suggest slight bullishness with SMA(20) above SMA(50) and a nearing stochastic buy signal. A break above 2.510 could lead to further bullish movement.
Read the full Natural gas technical analysis report below.
Natural Gas Technical Analysis
Weekly Natural Gas Technical Analysis
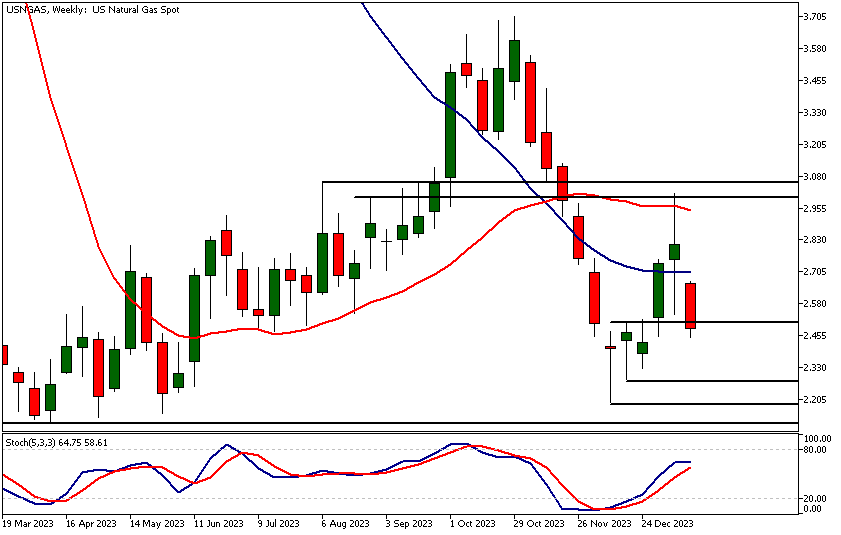
Natural gas is trading lower after the rally out of the reversal formation failed. The market is now back inside the reversal formation which marks the area where the bulls were willing to buy the market three weeks ago.
Traders should therefore focus on daily and intraday charts to see whether the market is likely to bounce higher again or continue to trade lower and possibly test the November low at 2.193. The nearest resistance level is 3.011. In the below daily and intraday natural gas technical analysis sections, we map out the key market structure levels and potential short-term price moves.
Daily Natural Gas Technical Analysis
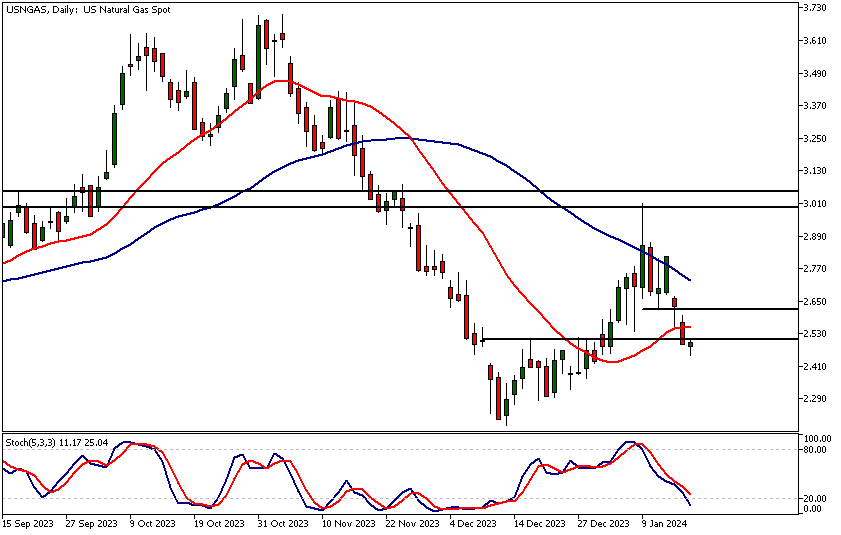
The market has fallen below the 2.510 support level. The market still trading in the proximity of it and could therefore bounce higher. However, the nearest key resistance level (2.618)is relatively close by possibly discouraging the bulls.
Indicator-based natural gas technical analysis indicates slight strength with the SMA(50) points lower but the SMA(20) has started to move higher. The stochastic oscillator is in the oversold area below 20 but has not yet given a buy signal.
Intraday Natural Gas Technical Analysis
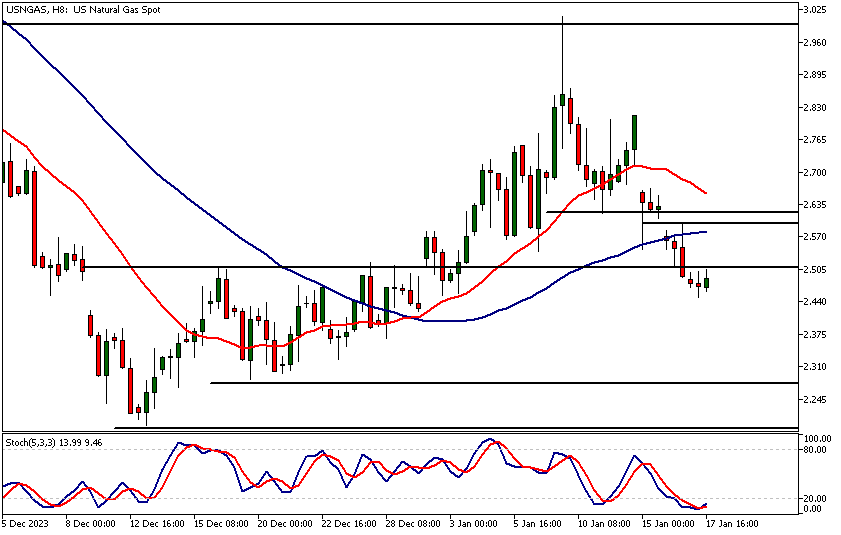
The 8h chart reveals a market structure area between 2.596 and 2.618 that could be a challenge for the bulls should the market rally there. If the market continues lower and there is no reaction higher from the current levels, look for a move down to 2.367.
In this timeframe, the moving averages are in a bullish order with the SMA(20) above the SMA(50) while the Stochastic oscillator is about to give a buy signal. Indicator-oriented Natural gas technical analysis therefore suggests slight bullishness in the 8h chart also but this needs to be confirmed with price action.
A decisive break above 2.510 could open the way to the market structure area between 2.596 and 2.618. Alternatively, a move down to 2.367 could be likely.
The next key risk events impacting this market:
- Unemployment Claims
- Natural Gas Storage
- Building Permits
- Philly Fed Manufacturing Index
- Prelim UoM Consumer Sentiment
- Existing Home Sales
- Prelim UoM Inflation Expectations
Potential Natural Gas Market Moves
Natural gas faces a dual scenario: a bullish outlook suggests a rebound above the 2.510 level, potentially targeting the 2.596-2.618 area, buoyed by bullish moving averages and a nearing stochastic buy signal. Conversely, bearish prospects loom with a potential drop towards 2.367, especially if it fails to overcome the resistance near 2.618, compounded by mixed technical indicators and the recent breach of the 2.510 support.

How Would You Trade the Natural Gas Today?
I hope this fundamental and technical Natural Gas analysis helps you to make better informed trading decisions. Check the latest market analysis for other instruments and subscribe to receive them in your inbox as soon as they are published
DISCLAIMER: TIO Markets offers an exclusively execution-only service. The views expressed are for information purposes only. None of the content provided constitutes any form of investment advice. The comments are made available purely for educational and marketing purposes and do NOT constitute advice or investment recommendation (and should not be considered as such) and do not in any way constitute an invitation to acquire any financial instrument or product. TIOmarkets and its affiliates and consultants are not liable for any damages that may be caused by individual comments or statements by TIOmarkets analysis and assumes no liability with respect to the completeness and correctness of the content presented. The investor is solely responsible for the risk of his/her investment decisions. The analyses and comments presented do not include any consideration of your personal investment objectives, financial circumstances, or needs. The content has not been prepared in accordance with any legal requirements for financial analysis and must, therefore, be viewed by the reader as marketing information. TIOmarkets prohibits duplication or publication without explicit approval.

Janne Muta holds an M.Sc in finance and has over 20 years experience in analysing and trading the financial markets.
Related Posts


Trade responsibly: CFDs are complex instruments and come with a high risk of losing all your invested capital due to leverage.