Oil Technical Analysis | Oil jumps 4.5% amid Yemen strikes
BY Janne Muta
|gennaio 12, 2024Oil Technical Analysis - USOIL has rallied by over 4.5% from yesterday’s low. The rally was fuelled by a joint air and sea strikes by the United States and Britain on Houthi military targets in Yemen. These strikes were a response to the Iran-backed group's attacks on Red Sea shipping and have raised fears about a broader Middle Eastern conflict.
Such a conflict would be likely to disrupt oil supplies, especially through the crucial Strait of Hormuz. These strikes represent a significant escalation in the Israel-Hamas conflict that began in October.
Iran's recent seizure of a tanker carrying Iraqi crude adds to the region's tensions, particularly near the Strait of Hormuz, a key oil transit chokepoint handling about 20% of global oil consumption. The situation in the Gulf of Oman, near the Strait, remains a major concern for global oil markets.
Summary of This Oil Technical Analysis Report:
- The oil market is showing signs of a potential trend reversal after consolidating above 67.94. It's currently at the lower end of a long-term range between 63.86 and 93.94. A successful break above 76.18 could lead to a rise towards 80.15, but failure might see a drop to around 64.50.
- USOIL has emerged from a bullish triangle formation, surpassing a crucial resistance at 74.25, aligned with the 50-period moving average. This breakout suggests a potential rise to 76.18 and then 77.92. However, falling below 74.25 could lead to a drop to 71.30.
- Following higher lows at 71.88 and 73.26, the market has breached the 74.25 resistance, turning it into support. The 20-period SMA is above the 50-period SMA, indicating bullishness, though the stochastic oscillator signals overbought conditions.
Read the full oil technical analysis report below.
Oil Technical Analysis
Weekly Oil Technical Analysis
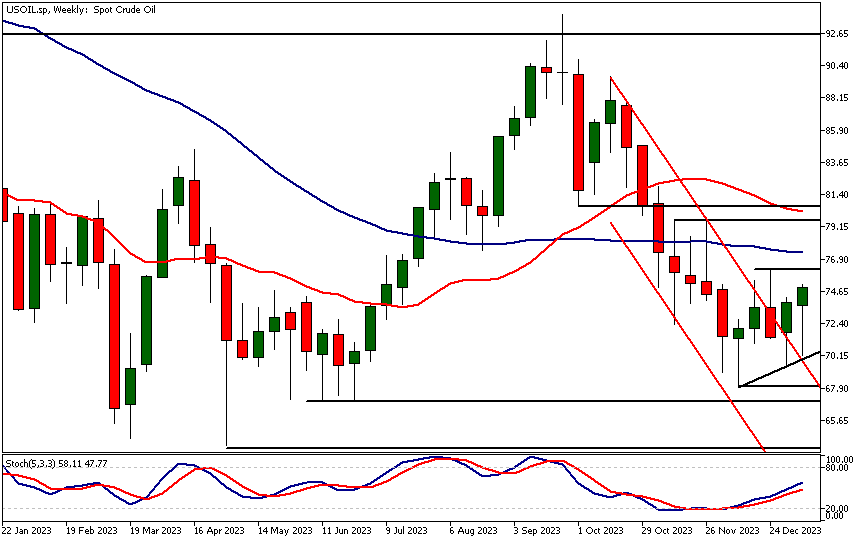
The oil market is currently consolidating above the 67.94 low, indicating that it may be in the midst of a bottoming process. This could lead to a trend reversal and a substantial rise in oil prices.
Concurrently, moving averages-based oil technical analysis suggests that the market has been in a prolonged sideways movement. Notably, the market has fluctuated between 63.86 and 93.94 since April of last year. The current reversal process is therefore taking place at the lower end of this long term price range.
For the market to successfully complete this bottoming process, it must break above the 76.18 resistance level. Should the bulls manage to propel the market beyond this threshold and generate sustained buying interest, we might see the market advancing towards the 20-period moving average, which currently stands at 80.15.
Conversely, if this reversal attempt fails and the market is unable to breach the 76.18 level, a decline to approximately 64.50 could be anticipated.
Daily Oil Technical Analysis
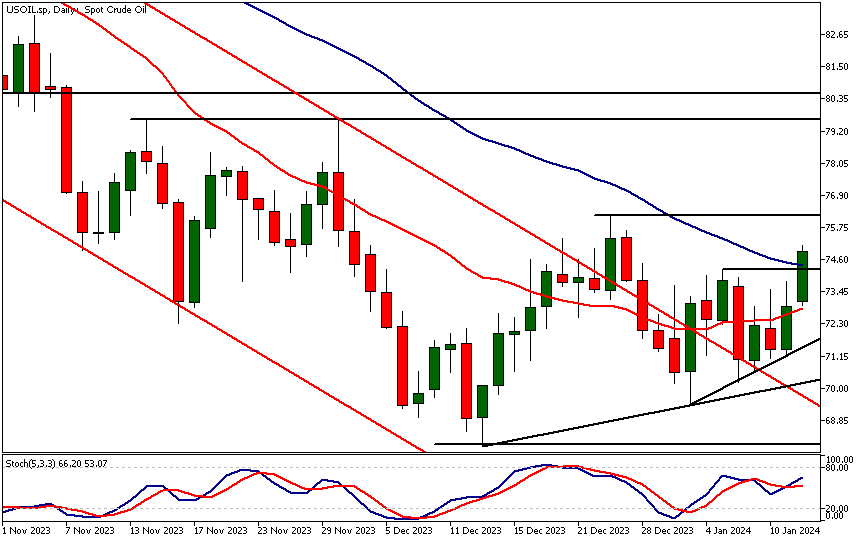
USOIL has broken out of a bullish triangle within another larger triangle formation as buyers have consistently supported the market at higher levels following each downward move. Now the market has broken above the high of the formation at 74.25.
This level is a key resistance point and is further reinforced by its close alignment with the 50-period moving average. The breakout from the formation suggests further upward move, possibly to 76.18, and then possibly to 77.92. Conversely, if the market fails to stay above 74.25, a decline to 71.30 could ensue.
Oil technical analysis, based on moving averages, suggests that the market may in the process of reversing the recent downtrend. This is evidenced by the 20-period moving average gradually rising and nearing the 50-period moving average.
Intraday Oil Technical Analysis
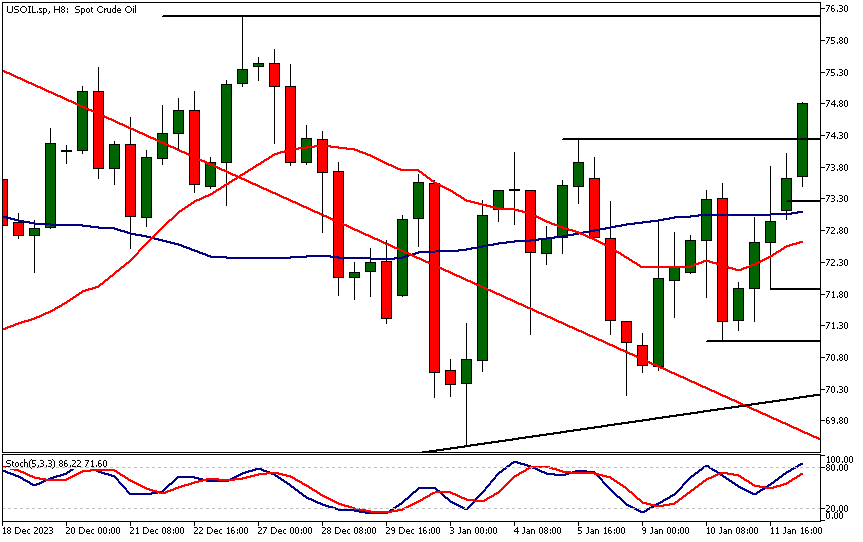
The market is currently trading higher after it has formed higher reactionary lows at 71.88 and 73.26. This morning the market has broken above a significant resistance at 74.25, turning the level into a support level.
Moving averages-based oil technical analysis indicates a bullish market, with the 20-period SMA positioned above the 50-period SMA. Additionally, the stochastic oscillator is at the overbought threshold, aligning with the fact that the market is trading close to a resistance level.
Client sentiment analysis
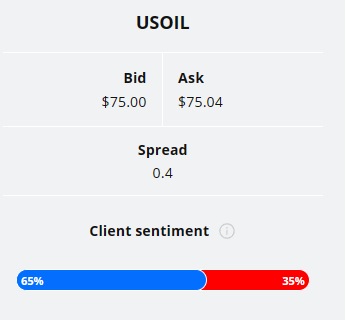
65% of clients trading USOIL are holding long positions, while 35% are holding short positions. Client sentiment data is being provided by TIO Markets Ltd.
It’s good to remember that retail client trading sentiment is a contrarian indicator as most retail traders are on average trading against market price trends. This is why experienced traders tend to trade against the retail client sentiment. You can follow the TIOmarkets client sentiment live on our Forex dashboard.
The next key risk events impacting this market
- USD - Core PPI m/m
- USD - PPI m/m
- USD - Empire State Manufacturing Index
- USD - Core Retail Sales m/m
- USD - Retail Sales m/m
- USD - Industrial Production m/m
- USD - Unemployment Claims
- USD - Crude Oil Inventories
- USD - Philly Fed Manufacturing Index
- USD - Prelim UoM Consumer Sentiment
- USD - Prelim UoM Inflation Expectations
Potential Oil Market Moves
If the market maintains the current upside momentum, a bullish scenario could see a rise towards 80.15 on a weekly scale, and potentially 77.92 daily. Conversely, a bearish outcome might lead to a decline to approximately 64.50 weekly, or to 71.30 daily, should key resistance levels fail to be breached.

How Would You Trade Oil Today?
I hope this Oil technical analysis helps you to make better informed trading decisions. Check the latest market analysis for other instruments and subscribe to receive them in your inbox as soon as they are published
DISCLAIMER: TIO Markets offers an exclusively execution-only service. The views expressed are for information purposes only. None of the content provided constitutes any form of investment advice. The comments are made available purely for educational and marketing purposes and do NOT constitute advice or investment recommendation (and should not be considered as such) and do not in any way constitute an invitation to acquire any financial instrument or product. TIOmarkets and its affiliates and consultants are not liable for any damages that may be caused by individual comments or statements by TIOmarkets analysis and assumes no liability with respect to the completeness and correctness of the content presented. The investor is solely responsible for the risk of his/her investment decisions. The analyses and comments presented do not include any consideration of your personal investment objectives, financial circumstances, or needs. The content has not been prepared in accordance with any legal requirements for financial analysis and must, therefore, be viewed by the reader as marketing information. TIOmarkets prohibits duplication or publication without explicit approval.

Janne Muta holds an M.Sc in finance and has over 20 years experience in analysing and trading the financial markets.
Related Posts
Trade responsibly: CFDs are complex instruments and come with a high risk of losing all your invested capital due to leverage.


