S&P 500 Technical Analysis | The market trades near the record high
BY Janne Muta
|gennaio 15, 2024S&P 500 Technical Analysis - The S&P 500 rallied to its December high on Friday, a level not far from the actual record high. The index remains just 0.3% below its all-time high (ATH) peak. Despite airline and discretionary spending stocks falling, the market finished slightly up. The energy sector saw the most significant rally, whilst discretionary stocks lost the most ground.
Investors are cautious due to high valuations in technology stocks amidst a weaker economy. Some institutional investors have shifted from technology to more defensive sectors, like healthcare. Although the Federal Reserve indicated a halt in interest rate hikes, market confidence remains shaky, partly due to geopolitical tensions, including US strikes in Yemen impacting oil prices.
Shipping costs are rising as the Red Sea is avoided, threatening further supply chain disruptions. Continued trends like this are likely to lead to higher inflation, especially if energy prices increase substantially.
Friday’s Producer Price Index (PPI) data revealed that producer prices in the US rose by 1% year-on-year in December, following a downwardly revised 0.8% increase in the previous period. This rise was below market expectations of a 1.3% increase.
Trading could be subdued today as the US equity markets observing the Martin Luther King day.
Summary of this S&P 500 technical analysis report:
- S&P 500 fluctuates below its all-time high, reflecting profit-taking by some institutional investors post-Q3 2023 rally. It's nearing its December high and ATH, but momentum is waning. Technical analysis suggests a long-term bullish trend, yet overbought conditions and proximity to ATH raise correction risks, with 4663 as a potential support.
- Higher lows since January 5th indicate strength but the overall momentum loss poses risks. Friday's indecisive trading hints at uncertainty. A break below 4758 could lead to a drop towards the 4721 – 4726 area. If 4758 holds, expect a move towards 4802 - 4820.
- The 8h chart shows hesitation below Thursday's high, influenced by Martin Luther King Day in the US. Bearish signs were seen Friday, but confirmation requires a drop below 4768.50. Below this, 4758 is key, potentially leading to 4716 - 4733. Resistance lies at 4802.
Read the full S&P 500 technical analysis report below.
S&P 500 technical analysis
Weekly S&P 500 technical analysis
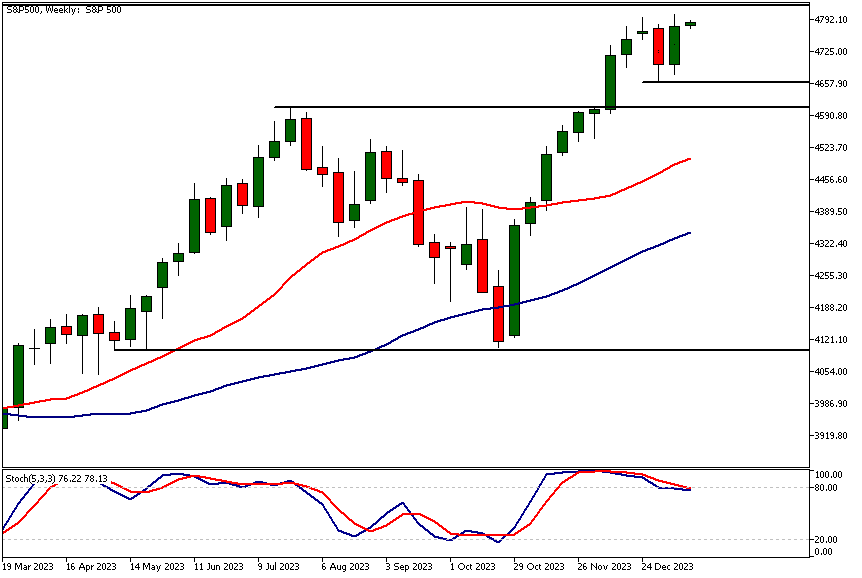
S&P 500 has been ranging below its ATH (4820.82) as some institutional investors have been taking profits after the outstanding rally we saw in Q3 2023. The market has now reached the December high (4796.88) and is nearing the all-time high (ATH) at 4820.82.
Even though the market gained last week roughly as much ground as it lost the week before the daily timeframe chart shows a loss of momentum below the December high. The weekly indicator-based S&P 500 technical analysis suggests the market is in a long-term bullish trend with the SMA(20) above the SMA(50) and both averages pointing higher.
The stochastic oscillator shows the market overbought and losing momentum though. This together with the fact that the market is trading at December highs and near the ATH increases the risk of correction in which case the nearest support at 4663 could come into play.
Daily S&P 500 technical analysis
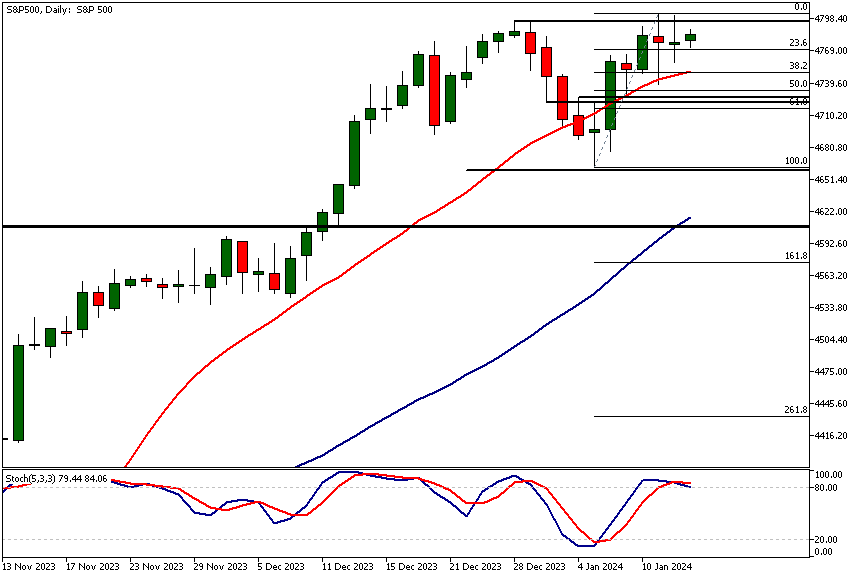
The market has been creating higher lows since January 5th attempting to push the market through the resistance levels (see the weekly S&P 500 technical analysis above). However, the loss of momentum seen on Thursday and Friday is a risk factor. Friday's inside candle indicates that traders are undecided.
Our S&P 500 technical analysis suggests that if the market cannot rally further and there is a decisive break below Friday's low (4758) the confluence area between the 50% and 61.8% Fibonacci retracement levels could come into play. This area also contains two market structure levels (4721.52 and 4726.55) that we focused on in the previous S&P 500 technical analysis report. Alternatively, if the 4758 level holds, look for a move to the 4802 - 4820 range.
Intraday S&P 500 technical analysis
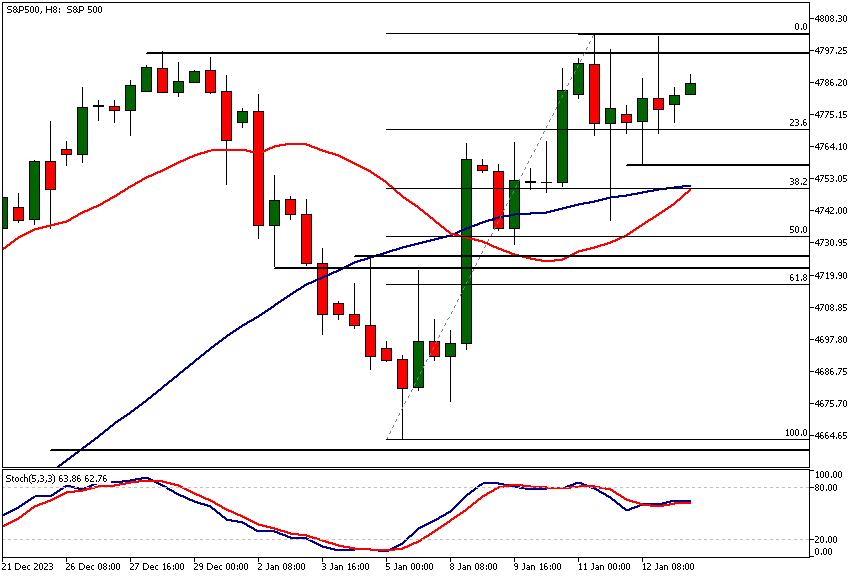
The 8h chart shows the market hesitating below Thursday's high probably related to the US equity markets observing Martin Luther King Day today. The S&P 500 futures and therefore CFD markets also will trade today until 6 pm UK time but liquidity is likely to be much lower than usual.
The bearish rejection candle formed on Friday suggests weakness but we'd need to see a move below its low (4768.50) to confirm the indication. The next key support level below the level is at 4758. If it breaks a move down to the 4716 - 4733 range (as identified in the daily S&P 500 technical analysis section). Conversely, the nearest resistance level is at 4802.
Client sentiment analysis
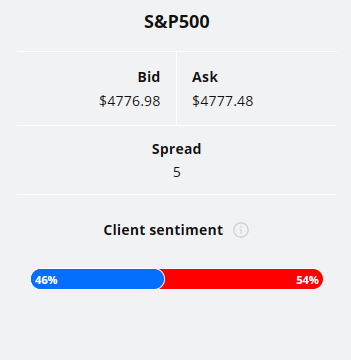
46% of clients trading S&P 500 are holding long positions, while 54% are holding short positions. Client sentiment data is being provided by TIO Markets Ltd.
It’s good to remember that retail client trading sentiment is a contrarian indicator as most retail traders are on average trading against market price trends. This is why experienced traders tend to trade against the retail client sentiment. You can follow the TIOmarkets client sentiment live on our Forex dashboard.
The next key risk events impacting this market:
- Empire State Manufacturing Index
- WEF Annual Meetings
- Core Retail Sales m/m
- Retail Sales m/m
- Industrial Production m/m
- Unemployment Claims
- Building Permits
- Philly Fed Manufacturing Index
- Prelim UoM Consumer Sentiment
- Existing Home Sales
- Prelim UoM Inflation Expectations
Potential S&P 500 Market Moves
Our S&P 500 technical analysis suggests that if the market cannot rally further and there is a decisive break below Friday's low (4758) the confluence area between the 50% and 61.8% Fibonacci retracement levels could come into play.
This area also contains two market structure levels (4721.52 and 4726.55) that we focused on in the previous S&P 500 technical analysis report. Alternatively, if the 4758 level holds, look for a move to the 4802 - 4820 range.

How Would You Trade the S&P 500 Today?
I hope this S&P 500 technical analysis report helps you to make better informed trading decisions. Check the latest market analysis for other instruments and subscribe to receive them in your inbox as soon as they are published
DISCLAIMER: TIO Markets offers an exclusively execution-only service. The views expressed are for information purposes only. None of the content provided constitutes any form of investment advice. The comments are made available purely for educational and marketing purposes and do NOT constitute advice or investment recommendation (and should not be considered as such) and do not in any way constitute an invitation to acquire any financial instrument or product. TIOmarkets and its affiliates and consultants are not liable for any damages that may be caused by individual comments or statements by TIOmarkets analysis and assumes no liability with respect to the completeness and correctness of the content presented. The investor is solely responsible for the risk of his/her investment decisions. The analyses and comments presented do not include any consideration of your personal investment objectives, financial circumstances, or needs. The content has not been prepared in accordance with any legal requirements for financial analysis and must, therefore, be viewed by the reader as marketing information. TIOmarkets prohibits duplication or publication without explicit approval.

Janne Muta holds an M.Sc in finance and has over 20 years experience in analysing and trading the financial markets.
Related Posts


Trade responsibly: CFDs are complex instruments and come with a high risk of losing all your invested capital due to leverage.