USDJPY Technical Analysis | Lowest core inflation since July 2022
BY Janne Muta
|gennaio 19, 2024USDJPY Technical Analysis - December 2023 saw Japan's annual inflation rate dip to 2.6%, the lowest since July 2022, primarily due to a slower rise in food prices. However, the core inflation rate, excluding volatile food and energy prices, remains above the BOJ's 2% target, standing at 2.3%.
This persistent inflationary pressure, coupled with a 3.7% increase in the "core core" index, signals a shift towards rising wages and prices in goods and services.
Such a wage-inflation dynamic could prompt the BOJ to consider rate hikes, a departure from its longstanding low-rate policy. This scenario suggests JPY could strengthen as higher interest rates may attract foreign investment.
Summary of This USDJPY Technical Analysis Report:
- USDJPY has reached a key market structure area (148.78-149.20) where profit-taking could occur, potentially leading to a retracement. Stochastics oscillator is approaching overbought levels, suggesting the market is nearing resistance. The nearest key support level is at 146.41.
- Profit-taking at the market structure area mentioned in the weekly USDJPY technical analysis above has turned the market lower today. If USDJPY closes below the opening level (148.15) today, it creates a bearish rejection candle. If this happens and the market breaks decisively below today's low (147.80), look for a move down to 146.15. Otherwise, another attempt to move the market above today's high (148.80) could follow.
- The moving averages in the 8h chart indicate a strong bullish trend in USDJPY, suggesting the market could continue to trend higher without any clear signs of a market reversal yet. However, if the market creates a bearish rejection (shooting star) candle in the daily chart and if the minor support level (147.65) breaks, the bears could be targeting the 146.15 level.
Read the full USDJPY Technical Analysis report below.
USDJPY Technical Analysis
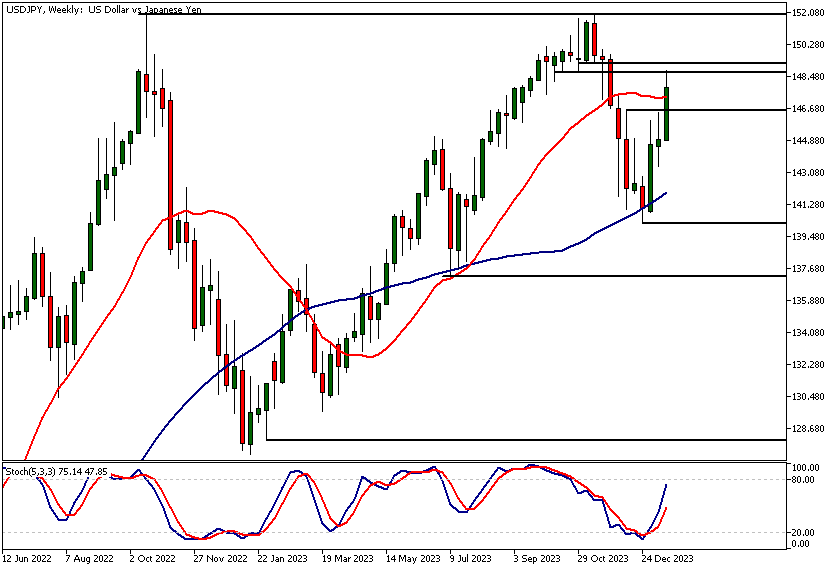
USDJPY Technical Analysis, Weekly Chart
USDJPY has been rallying strongly over the last three weeks with both SMA20 and SMA50 points higher indicating a bullish long-term trend. The market has, however, reached a key market structure area at 148.78 - 149.20.
This could bring in profit-taking and slow the rally down or create a retracement. Stochastics oscillator is approaching overbought levels suggesting the market is getting near to resistance levels. The nearest key support level is at 146.41.
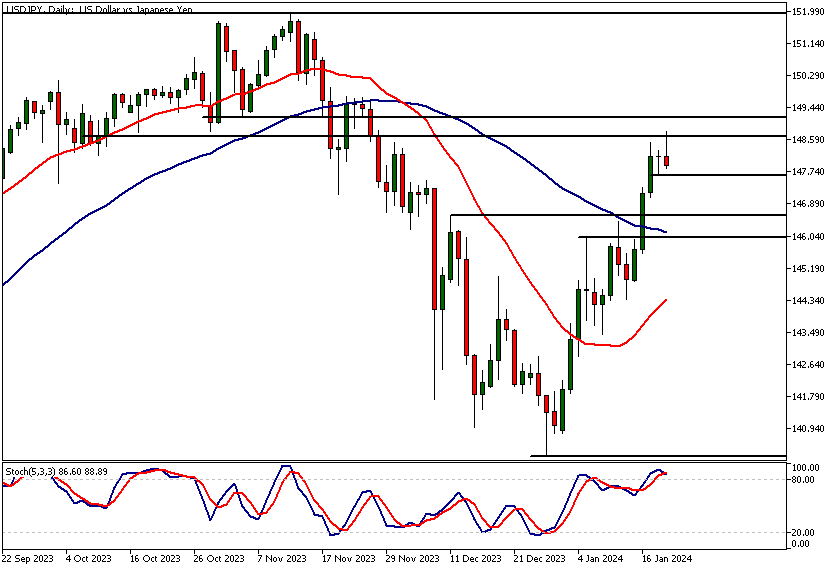
USDJPY Technical Analysis, Daily Chart
Profit taking at the market structure area mentioned in the weekly USDJPY technical analysis above has turned the market lower today. If USDJPY closes below the opening level of 148.15 today it creates a bearish rejection candle.
If this is the case and the market breaks decisively below today's low, look for a move down to 146.15. This however is still speculation until we see how the market closes today and whether these early signs of weakness turn into a corrective move lower. As the uptrend has been strong trend continuation move to 147.60 could be likely.
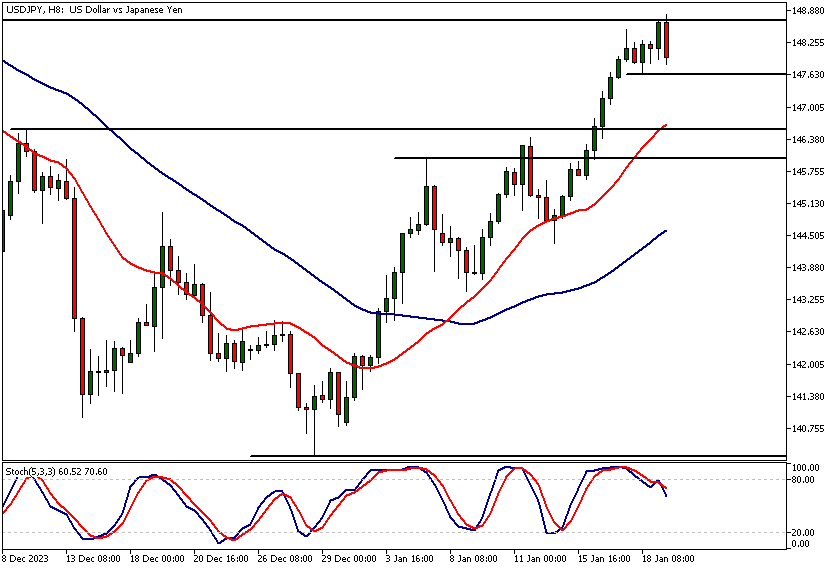
Intraday USDJPY Technical Analysis
The moving averages indicate a strong bullish trend in USDJPY. This suggests the market could still trend higher without any clear signs of market reversal yet. However, if the market creates a bearish rejection (shooting star) candle in the daily chart and if the minor support level at 147.65 breaks the bears could be targeting the 146.15 level.
Note that the SMA20 is closely aligned with the 147.65 level adding to the technical significance of the level. If the weakness continues below 146.15 the 146 level could be tested.
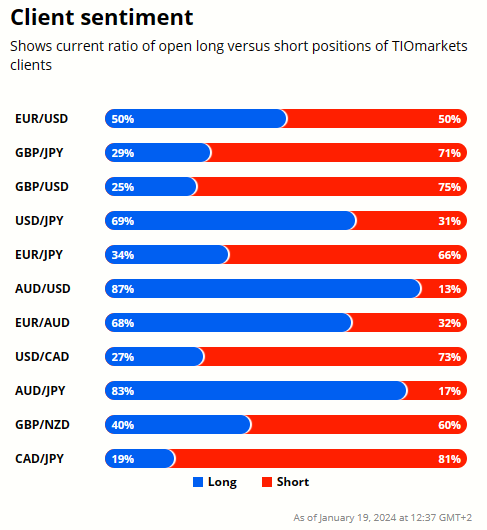
Client sentiment analysis
69% of clients trading USDJPY are holding long positions, while 31% are holding short positions. Client sentiment data is being provided by TIO Markets Ltd.
Please note that retail client trading sentiment is generally a contrarian indicator, as private (non-professional) traders, on average, trade against market price trends. You can follow the TIOmarkets client sentiment live on our Forex dashboard.
The next key risk events impacting this market
- USD - Prelim UoM Consumer Sentiment
- USD - Existing Home Sales
- USD - Prelim UoM Inflation Expectations
- JPY - Monetary Policy Statement
- JPY - BOJ Policy Rate
- JPY - BOJ Outlook Report
- JPY - BOJ Press Conference
- USD - Richmond Manufacturing Index
- USD - Flash Manufacturing PMI
- USD - Flash Services PMI
- USD - Advance GDP q/q
- USD - Unemployment Claims
- USD - Advance GDP Price Index q/q
- USD - Core Durable Goods Orders m/m
- USD - Durable Goods Orders m/m
- USD - New Home Sales
- JPY - Tokyo Core CPI y/y
- USD - Core PCE Price Index m/m
- USD - Pending Home Sales m/m
Potential USDJPY Market Moves
The moving averages indicate a strong bullish trend in USDJPY. This suggests the market could still move higher possibly targeting 149.60. However, if the market creates a bearish rejection (shooting star) candle in the daily chart and if the minor support level at 147.65 breaks a move the 146.15 level could be likely.

How would you trade the USDJPY today?
I hope this USDJPY technical analysis helps you to make better informed trading decisions. Check the latest market analysis for other instruments and subscribe to receive them in your inbox as soon as they are published
DISCLAIMER: TIO Markets offers an exclusively execution-only service. The views expressed are for information purposes only. None of the content provided constitutes any form of investment advice. The comments are made available purely for educational and marketing purposes and do NOT constitute advice or investment recommendation (and should not be considered as such) and do not in any way constitute an invitation to acquire any financial instrument or product. TIOmarkets and its affiliates and consultants are not liable for any damages that may be caused by individual comments or statements by TIOmarkets analysis and assumes no liability with respect to the completeness and correctness of the content presented. The investor is solely responsible for the risk of his/her investment decisions. The analyses and comments presented do not include any consideration of your personal investment objectives, financial circumstances, or needs. The content has not been prepared in accordance with any legal requirements for financial analysis and must, therefore, be viewed by the reader as marketing information. TIOmarkets prohibits duplication or publication without explicit approval.

Janne Muta holds an M.Sc in finance and has over 20 years experience in analysing and trading the financial markets.
Related Posts


Trade responsibly: CFDs are complex instruments and come with a high risk of losing all your invested capital due to leverage.