Trade Indices CFDs
米国、英国、ヨーロッパ、アジア、オーストラリアの株価指数を取引
取引にはリスクが伴います
インデックス元
US, 英国、EU、アジア
取引元
$0 委託
まで
1: 100倍のレバレッジ
+
16 指標
インデックス元
US, 英国、EU、アジア
取引元
$0 委託
まで
1: 100倍のレバレッジ
+
16 指標
Trade global stock market indices
シンボル
Bid
Ask
スプレッド

*このページの価格は参考価格です。エキゾチック通貨ペア、株式、指数など流動性の低い商品の価格は、一般的に取引される商品ほど頻繁に更新されません。最新のリアルタイム価格については、MT4/MT5プラットフォーム内でご確認ください。
What are indices?
Indices represent a collection of stocks organised by industry sector or country with their aggregate performance being tracked. Indices are particularly useful for monitoring the broader stock market's general performance. As well as providing a singular tradable instrument for gaining exposure in all the indices constituent stocks.

Popular indices include
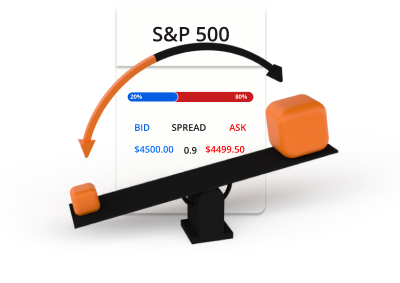
S&P 500
Symbol: S&P500
An index composed of 500 large US companies, representing the overall US stock market.
Dow Jones
Symbol: DJ
An index that tracks 30 large publicly-owned U.S. companies.
Nasdaq
Symbol: NAS
An index that includes all the stocks listed on the NASDAQ stock exchange. The Nasdaq is heavily influenced by the technology sector.
FTSE 100
Symbol: UK100
An index representing the 100 largest companies listed on the London stock exchange in the UK.
DAX
Symbol: DE30
An index of the major German companies listed on the Frankfurt Stock Exchange.
Euro Stoxx 50
Symbol: STOXX50
An index of Europe's leading blue-chip companies from 12 Eurozone member states.
IBEX 35
Symbol: ESP35
A Spanish stock market index comprising 35 of the most liquid stocks traded on the Madrid stock exchange.
ASX 200
Symbol: AUS200
A benchmark index of the top 200 companies listed on the Australian securities exchange.
Nikkei 225
Symbol: JP225
A stock market index representing 225 large Japanese companies listed on the Tokyo stock exchange.
Hang Seng Index
Symbol: HK50
An index representing 50 largest and most liquid companies listed on the Hong Kong stock exchange.
How Indices trading works
Indices trading allows you to trade on the performance of a group of stocks without needing to buy shares in each individual company. If you think the value of the index is likely to rise, you can simply buy the index. If you think the value of the index is likely to fall, you can sell it.
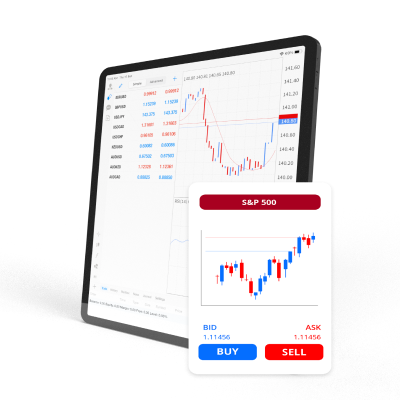
Bid and ask prices
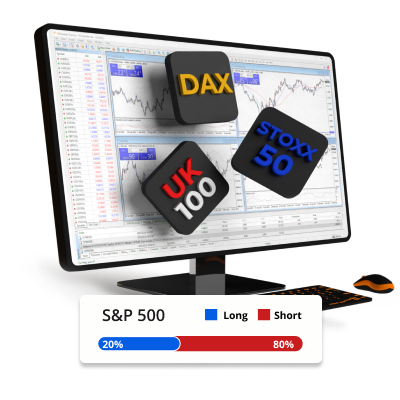
ロングまたはショート

Indices are traded in lots
Indices trading involves leverage and margin
Indices trading example
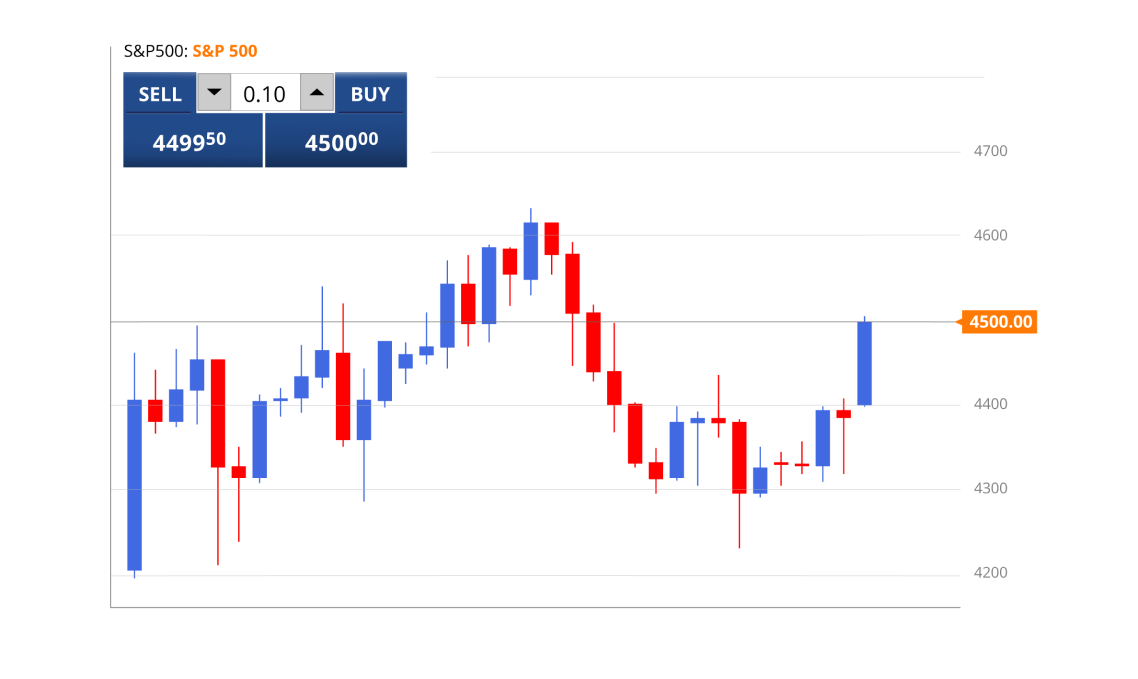
You decide to buy 0.1 lots of the S&P500 at 4500 using 100:1 leverage.
10 indices contracts x 4500 = USD 45,000
USD 45,000
USD 45,000 / 100 = USD 450
Now you have opened a long position in the S&P500 worth USD 45,000. Since indices are traded using leverage, only $450 was used as margin from your trading account. After some time, the price of the S&P500 moves and you decide to sell.
Scenario 1
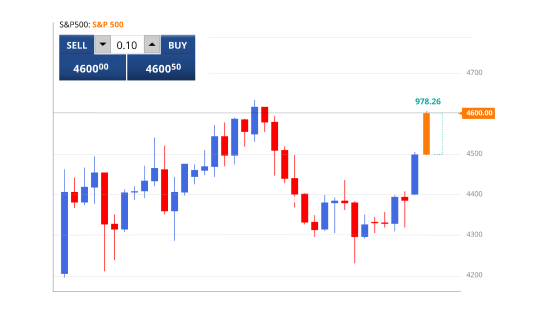
The S&P500 moves up from 4500 to 4600 and you decide to sell.
This is how the profit or loss on the trade would be calculated.
P/L = (Current price - Initial price) x Position value) / Current price
P/L= ((4600 - 4500) x 45,000) / 4,600
P/L = (100 x 45,000) / 4,600
P/L = 978.26
Scenario 2
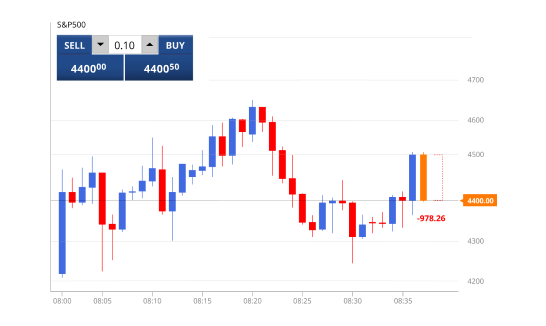
The S&P500 moves down from 4500 to 4400 and you decide to sell.
This is how the profit or loss on the trade would be calculated.
P/L = (Current price - Initial price) x Position value) / Current price
P/L = ((4400 - 4500) x 45,000) / 4,400
P/L = (-100 x 45,000) / 4,600
P/L = -978.26
なぜTIOmarketsなのか
だからこそ、あなたのような人が TIOmarkets を選びます

スプレッドは0.0 pipsから
Raw口座で変動制のロー・スプレッド取引

手数料無料の取引
VIP BlackまたはStandard取引口座で1ロットあたり$0から取引可能

トレーディングプラットフォーム
デスクトップ、ウェブ、モバイル対応の高度な取引プラットフォーム

迅速な注文執行
ミリ秒単位での効率的かつ信頼性の高い注文処理

無制限のレバレッジ
Standard口座では最大無制限レバレッジで取引可能

30%ロイヤリティボーナス
Standardアカウントへの全ての入金でボーナスを獲得
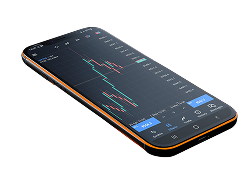
Trade on the MT4 trading platform
デスクトップ、ウェブブラウザ、モバイルから利用可能


数分で取引を開始できます。
仕組みはこうだ

ステップ 1
登録する
プロフィールを完了して口座を作成しましょう。わずか数分で完了します。

ステップ 2
確認する
本人確認書類および住所確認書類をアップロードしてください。出金前に必須です

ステップ 3
基金
便利な国内外の方法から選び、即時に入金できます

ステップ 4
取引
プラットフォームをダウンロードし、口座へ資金を振り替え、ログインして取引を開始します
取引にはリスクが伴います