How to Draw Support and Resistance
BY Chris Andreou
|11 23, 2023Knowing how to draw support and resistance for trading is an essential skill to have in technical analysis. Although it is one of the most basic concepts, it is also regarded as one of the most important.
Why is that?
Simply put, learning how to draw support and resistance correctly serves as the basis for understanding price charts. Which can significantly help you to make better informed trading decisions.
Other aspects of technical analysis are also heavily dependent on this concept. Failing to grasp it can hinder your ability to anticipate turning points in the market and potential price trajectories.
So in this article, I am going to show you how to identify and draw support and resistance levels.
How to Draw Support and Resistance
Support and resistance levels are very important for traders. because they are price points where the market tends to stop going up or down, or reverse direction. As a result, they can be used as triggers for entering trades in either direction.
In order to draw support and resistance levels on your chart using the MT4 or MT5 trading platform. You can follow this simple process.
1. Open a price chart
The first step is to identify the instrument you want to analyze. Generally speaking the higher time frames provide a better perspective for drawing support and resistance levels.
2. Find the significant highs and lows
Look for the significant turning points or swing highs and lows. These turning points where price reversed once or more are potential areas to draw support and resistance levels.
3. Draw the support and resistance lines
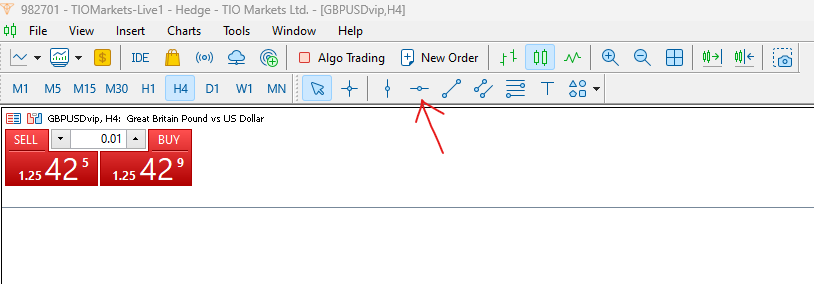
Use the horizontal line tool in your trading platform by connecting significant highs or lows in the price. If the price has traded to the same area twice or more and didn't surpass it, then it's probably a valid support or resistance area.

4. Check for validity
A line drawn through just one or two price points may not be valid. The price needs to approach the support or resistance line and then turn back. The more times the level is tested by price, the more significant it becomes. However, that does not mean price won't break through it in the future.
Using support and resistance is one of the most basic trading strategies a trader can use and it can be very effective.
However, drawing support and resistance levels is subjective and there are many different types. So few traders are likely looking at the same levels on their charts. Which can make it difficult to know whether a support or resistance level will be valid.
I will explain the different types in just a moment but before we get there, it's worth mentioning how not to draw support and resistance.
How not to draw support and resistance on your charts
When charts are cluttered with irrelevant lines and indicators, it can potentially lead to misinterpretation of data or trigger analysis paralysis.
Not every fluctuation in price is relevant, so focusing on the most decisive support and resistance levels will allow for better visibility of potential turning points or breakout zones.

The more your charts become cluttered with minor or irrelevant support or resistance levels, the more confusion it can cause. So having a clean chart enables quicker and more relevant decision making.
Now that you know what not to do, let's look at how to draw support and resistance correctly. Starting with an explanation.
What is support and resistance in trading
Support and resistance are fundamental concepts in trading, utilized in technical analysis to determine potential price levels where an asset's price is likely to reverse or pause. These levels are historical in nature and projected into the future to help traders forecast the market and guide their decision making process.
Support
This is a price level at which demand for an asset is strong enough to pause or reverse downward price movements. When the price of an asset declines, buyers may perceive it as more attractive. In turn, increasing demand can stop the price from falling further. Support levels are commonly referred to as a "floor" that prevents the price from dropping lower.
Resistance
Conversely, this is a price level where selling pressure is adequate enough to halt or reverse upward price movements. As an asset's price rises, sellers may perceive it as overvalued and increases in supply can stop the price from rising further. Resistance levels are commonly referred to as a "ceiling" that stops the price from rising higher.
Why does support and resistance form
Support and resistance levels form on price charts due to the underlying psychology of market participants and the balance between supply and demand. Although historical in nature, these levels are crucial because they illustrate the reactions of buyers and sellers to particular price points.
Over time and as more traders observe these historical turning points, support and resistance levels become even more significant. As they reinforce the expectations of what the market is likely to do when the price reaches these levels again.
So traders watch these historical levels and make buying and selling decisions in the present moment. In effect, support and resistance levels become a reflection of market psychology. But they traders see the same thing and think alike.
The different types of support and resistance
Traders utilizing technical analysis in their decision making use different types of support and resistance levels to predict future price movements. Here are some of the most commonly used.
Horizontal support and resistance levels
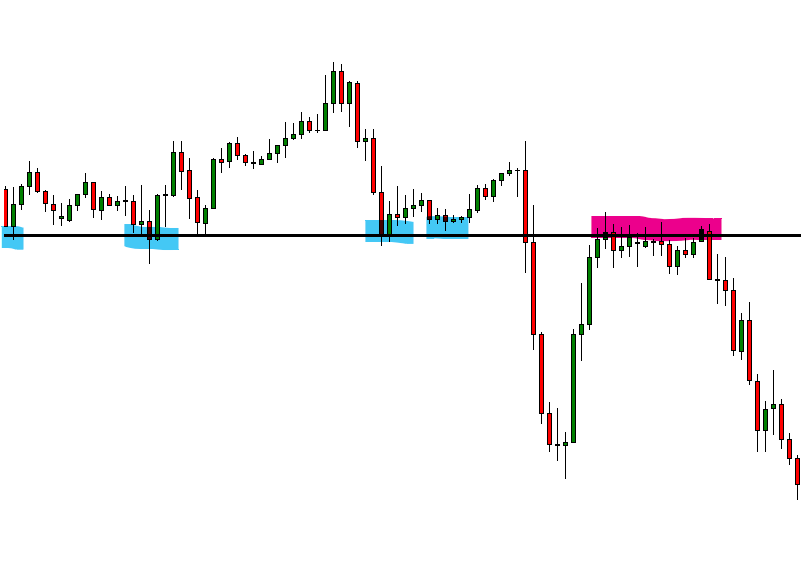
This type is depicted using a straight line, usually connecting two or more relatively equal price points where price has reversed in the past. This is the most common and straightforward type of support and resistance used by traders. Here is an example;

Trendline support and resistance
Unlike horizontal lines, Trendline support or resistance levels are drawn diagonally. Following a clear upward or downward price trend. This type of support and resistance is drawn by connecting consecutive low points for up trends (support) and high points for down trends (resistance).

Dynamic support and resistance
These levels are not straight lines and adjust according to the price behavior. Traders often use moving averages to represent dynamic support and resistance levels, as price tends to bounce off these moving averages.

Psychological support and resistance
These are levels that traders believe will result in significant price action. The psychological levels are around round numbers like $10, $20, or $100 for stocks and 1.1100, 1.1200 or 1.1300 for currencies. Other psychological levels could be the halfway or quarter levels like 1.1150, 1.1175 for example. This is because it is easy and natural for people to think and operate in round-numbered terms.

Pivot points
Pivot points are another common method used by day traders to identify potential support and resistance levels. The definition of a pivot point also varies because there are many different calculation methods. For example, there are camarilla pivot points, demark pivot points and pivot points in price where support becomes resistance and vice versa. You can look into these for yourself but here is an example of price pivoting and previous support acting as resistance.

Fibonacci retracement levels
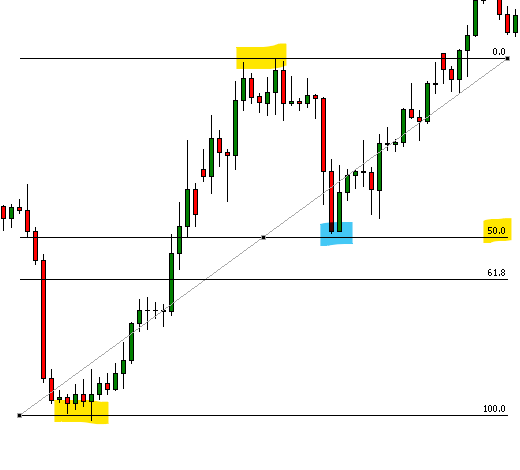
Are also used to identify horizontal support and resistance levels based on the retracement levels between a swing high and swing low. The idea is that after a significant price movement, an asset's price will often retrace a portion of the original price move. With these retracement levels corresponding to a number in the Fibonacci sequence. For example, the 23.6%, 38.2%, 50%, 61.8%, and 100% retracement levels are observed as potential support and resistance levels. Here is an example of price retracing the previous move to find support at the 50% retracement level, then resuming the original trend.

How to identify good support and resistance levels
Identifying good support and resistance levels to help you make trading decisions is subjective. Other than the variety and different types being used, you also have to consider all the different trading styles and timeframes being observed by market participants.
So where do you start to identify good support and resistance levels? How will you know a support or resistance level is valid?
These are valid questions and I will do my best to answer below.
How to trade using support and resistance
1. Identify the support or resistance level
Once you have identified the levels where the asset price has not broken through in the past. This includes points where the price has bounced off the level multiple times, either on the top side (forming resistance) or the bottom side (forming support).
2. Wait for price to approach the level
As price approaches the levels you have identified, observe the price action and how price reacts to the level carefully.
3. Trade the bounce
If the price approaches a support level and starts to show signs that it will bounce back up, look for a signal or additional confirmation to place a buy. Similarly, if the price approaches a resistance level and shows signs that it might begin to drop, look for a signal or additional confirmation to place a sell. The signal or confirmation could come from a candlestick pattern or another technical indicator.
4. Trade the break
Sometimes, the price may not bounce off the support or resistance level but break through it. In this case, you might consider trading the break out. One of the most common techniques is to wait for price to retest the support or resistance area. To show signs that previous support will become resistance and previous resistance will become support.
Now it is important to remember these levels are not exact and are better thought of as areas or zones. Price often pierces through support and resistance levels briefly before returning. We refer to this as a fake-out. Where price appears to break through a support or resistance level only to reverse its course.

Conclusion
The ability to accurately plot support and resistance levels on a chart is an important skill for any trader to have. These levels provide insightful information regarding the potential pause or reversal points of market trends. While this is subjective, support and resistance is based on the supply and demand dynamics in the market. As well as reflecting the psychology of market participants.
When trading, knowledge is power, and understanding how to draw support and resistance levels accurately can provide a solid foundation onto which a trader's strategy or skill can be built.
But as with any form of technical analysis, it requires adaptation to market conditions, continuous learning and the ability to effectively manage risk.
Take your knowledge further with TIOmarkets
This is where education meets excellence, take your knowledge further with our suite of educational resources and sign up to our free forex trading course. Then put your knowledge to the test on a demo or live trading account.
With TIOmarkets, you can trade more than 300+ instruments in the forex, indices, stocks, commodities and futures markets, all with low fees and fast order execution speeds.
Whether you are a beginner or experienced traders, we are committed to providing you with 24/7 customer support and the tools you need to trade effectively.
Register your account with TIOmarkets.

Risk disclaimer: CFDs are complex instruments and come with a high risk of losing money rapidly due to leverage. You should consider whether you understand how CFDs work and whether you can afford to take the high risk of losing your money. Never deposit more than you are prepared to lose. Professional client’s losses can exceed their deposit. Please see our risk warning policy and seek independent professional advice if you do not fully understand. This information is not directed or intended for distribution to or use by residents of certain countries/jurisdictions including, but not limited to, USA & Countries included in the OFAC sanction list. The Company holds the right to alter the aforementioned list of countries at its own discretion.
TIOmarkets offers an exclusively execution-only service. The views expressed are for information purposes only. None of the content provided constitutes any form of investment advice. The comments are made available purely for educational and marketing purposes and do NOT constitute advice or investment recommendation (and should not be considered as such) and do not in any way constitute an invitation to acquire any financial instrument or product. TIOmarkets and its affiliates and consultants are not liable for any damages that may be caused by individual comments or statements by TIOmarkets analysis and assumes no liability with respect to the completeness and correctness of the content presented. The investor is solely responsible for the risk of his/her investment decisions. The analyses and comments presented do not include any consideration of your personal investment objectives, financial circumstances, or needs. The content has not been prepared in accordance with any legal requirements for financial analysis and must, therefore, be viewed by the reader as marketing information. TIOmarkets prohibits duplication or publication without explicit approval.
Join us on social media

Experienced independent trader


