Negociação de futuros
Negociar ou cobrir o risco sem taxas de swap
O trading envolve riscos
ÍNDICES DE
US, REINO UNIDO, UNIÃO EUROPERIA E ÁSIA
NEGOCIE A PARTIR DE
$0 COMISSÃO
ATÉ
1: ALAVANCAGEM DE 100 VEZES
4 FUTUROS
ÍNDICES DE
US, REINO UNIDO, UNIÃO EUROPERIA E ÁSIA
NEGOCIE A PARTIR DE
$0 COMISSÃO
ATÉ
1: ALAVANCAGEM DE 100 VEZES
4 FUTUROS
Negociar mercados de futuros
Símbolo
Lance
Perguntar
Spread

*Os preços nesta página são indicativos. Os preços dos instrumentos com menor liquidez, tais como, entre outros, pares de moedas exóticas, ações e índices, não são atualizados com tanta frequência como os instrumentos normalmente negociados. Verifique em sua plataforma MT4/MT5 os preços ao vivo mais recentes
O que são futuros
Os futuros são contratos de derivados que obrigam as partes envolvidas a comprar ou vender um ativo numa data futura pré-determinada e a um preço definido. O preço é derivado do ativo subjacente e a natureza destes contratos torna-os úteis para negociação e cobertura. Os contratos de futuros têm uma data de expiração e não há taxas de swap overnight envolvidas, pelo que são muito rentáveis para a negociação a longo prazo.

Sem trocas nocturnas

Ótimo para sebes

Negociar com alavancagem
Como funciona a negociação de futuros
A negociação de futuros funciona de forma semelhante à negociação de CFD, mas cada contrato de futuros tem uma data de expiração. Pode encerrar a sua posição em qualquer altura ou deixar o contrato encerrar no final do prazo. Se pretender manter a sua posição após a data de expiração, pode abrir uma nova posição num contrato de futuros com uma data de expiração posterior. Os contratos de futuros são actualizados frequentemente com novas datas de expiração e a data de expiração de cada contrato de futuros é indicada pelo sufixo dos símbolos. Por exemplo, DJ.H24 é um contrato de futuros Dow Jones que expira em março de 2024. SP.N24 é um contrato de futuros S&P 500 que expira em julho de 2024.
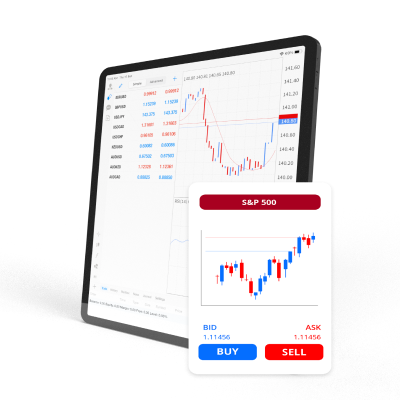
Preços de compra e venda
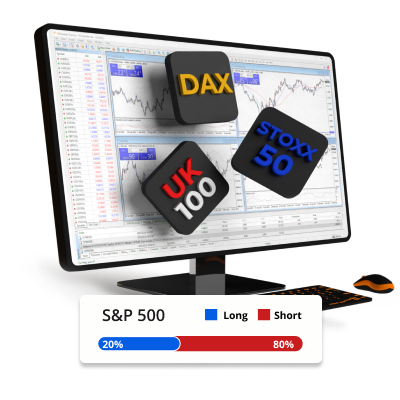
Assuma posições longas ou curtas

Os futuros são transaccionados em lotes
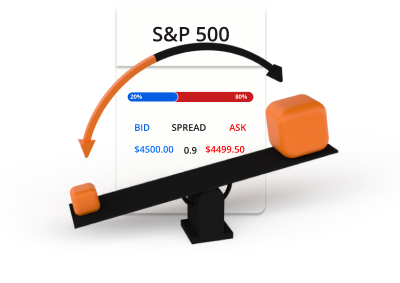
A negociação de futuros envolve alavancagem e margem
Exemplo de negociação de futuros
Decide comprar 0,1 lotes de futuros S&P500 a 4500 utilizando uma alavancagem de 100:1.

5 contratos de futuros x 4500 = 22.250 USD
USD 22,250
USD 22,250 / 100 = USD 225
Agora abriu uma posição longa no S&P500 no valor de 22.250 USD. Uma vez que os futuros são negociados com alavancagem, apenas 225 USD foram utilizados como margem da sua conta de negociação. Passado algum tempo, o preço do S&P500 desloca-se e decide vender.
Cenário 1 1

O S&P500 sobe de 4500 para 4600 e decide vender.
É assim que se calcula o lucro ou a perda da transação.
P/L = (Preço atual - Preço inicial) x Valor da posição / Preço atual
P/L = ((4600 - 4500) × 22,250) / 4,600
P/L = (100 × 22,250) / 4,600
P/L= 483.70
Cenário 1 2

O S&P500 desce de 4500 para 4400 e o investidor decide vender.
É assim que se calcula o lucro ou a perda da transação.
P/L = (Preço atual - Preço inicial) x Valor da posição / Preço atual
P/L = ((4400 - 4500) × 22,250) / 4,400
P/L = (-100 × 22,250) / 4,600
P/L = -483.70
Porquê a TIOmarkets?
É por esse motivo que pessoas como você escolhem a TIOmarkets

Spreads a partir de 0.0 pips
Negocie com spreads variáveis brutos na conta Raw

Trading sem comissões
Negocie a partir de $0 por lote nas nossas contas VIP Black ou Standard

MT4 & MT5
Plataformas de trading avançadas para desktop, web e dispositivos móveis

Execução rápida de ordens
Processamento de ordens estável e eficiente em milissegundos

Leverage ilimitado.
Negocie com alavancagem ilimitada na conta Standard

Bônus de fidelidade de 30%
Receba um bônus a cada depósito na nossa conta Standard
Negocie nas plataformas MT4 ou MT5
Do seu computador, navegador ou dispositivo móvel
Comece a operar em minutos
Como funciona:
PASSO 1
Registro
Complete seu perfil e crie sua conta, leva apenas alguns minutos

PASSO 2
Verificação
Envie seu comprovante de identidade e endereço (obrigatório antes de sacar fundos)

PASSO 3
Depósito
Selecione entre métodos locais e internacionais convenientes e deposite instantaneamente

PASSO 4
Trading
Baixe a plataforma, transfira fundos para sua conta, inicie sessão e comece a operar
O trading envolve riscos
