Trend Reversal Secrets: Golden Opportunities
BY Janne Muta
|กุมภาพันธ์ 1, 2567A trend reversal in the gold market indicates a fundamental shift in the price direction, marking the end of a current trend and the beginning of a new one. It can emerge after an uptrend or downtrend, and its accurate identification is vital for finding profitable trading opportunities.
These reversals are golden opportunities (pun intended) and are often spotted using price action, market structure analysis, or various indicators like moving averages and oscillators. However, these indicators are more effective when combined with price action and market structure analysis.
This article serves as a comprehensive guide to trend reversals in the gold market, exploring their types and the supply and demand dynamics behind them.
Trend reversal key takeaways
- Trend reversals are crucial for traders to identify as they signal a shift in market direction. Understanding the different types of reversals, such as U-reversals, double tops and bottoms, triple bottom reversals, and V-reversals, provides valuable insights into market sentiment and potential price movements.
- Demand and supply dynamics play a key role in market reversals. When demand outpaces supply, prices tend to rise, leading to uptrends. Conversely, when supply exceeds demand, prices decline, resulting in downtrends. Understanding these dynamics helps traders anticipate and capitalize on market reversals.
- U-reversals are gradual and rounded, often indicating a more sustainable change in market direction. Double top and bottom patterns involve two peaks or troughs, signalling potential bullish or bearish reversals. Triple bottom reversals involve three consecutive troughs, suggesting a strengthening trend reversal. V-reversals are sudden and sharp, often driven by news events or market overreactions.
- Trend reversals in the gold market have been influenced by factors such as economic conditions, geopolitical events, and central bank actions. U-shaped reversals, double bottom reversals, triple bottom reversals, and V-shaped reversals have all occurred in the gold market, providing insights into the dynamics of this asset class.
- Recognizing market reversals is essential for traders as they provide valuable information about market sentiment and potential price movements. The different types of reversals - U-reversals, double tops and bottoms, triple bottom reversals, and V-reversals - each offer unique insights into market dynamics. Real-world examples in the gold market illustrate how these reversals can occur and how traders can capitalize on them.

Trend reversals mark a significant change in the direction of stocks, commodities, currencies, or indices. They indicate a shift in institutional trader positions, and aligning with these new trends is crucial for retail traders. Understanding market reversals is key in market analysis, particularly in gold trading.
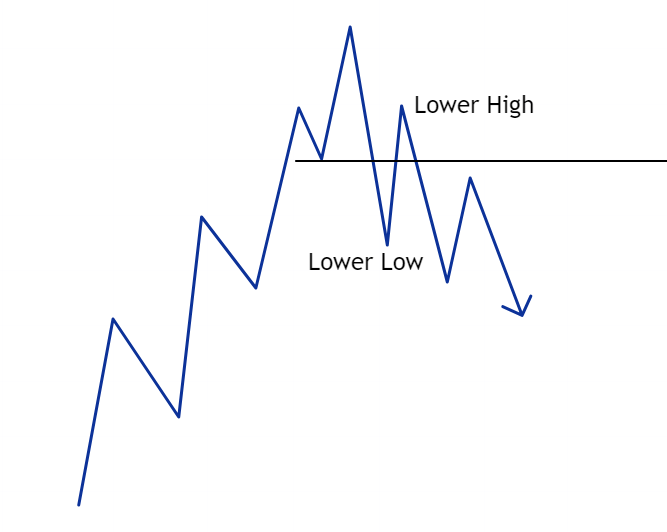
It involves discerning the difference between a trending market and a trend reversal. Trends exhibit consistent price movements in a specific direction and are characterised by patterns such as higher highs and lows in uptrends, and lower highs and lows in downtrends.
Spotting trend reversals
A trend reversal, however, signals a change in market sentiment, potentially leading to a shift in price direction. Traders identify reversals through signs like chart patterns or technical indicators diverging from the current trend. This understanding enables traders to adjust their positions in anticipation of the market's new direction.
Traders may notice signs of a reversal, such as chart patterns or technical indicators diverging from the trend. In response, they may shift their positions from buyers to sellers (or vice versa) as they anticipate a change in the market direction.
In summary, a trending market exhibits a consistent price movement in one direction while respecting key support or resistance levels, driven by ongoing demand or supply. In contrast, a trend reversal signifies a change in market sentiment, often accompanied by the clearing of demand or supply levels, as traders adapt to the shifting dynamics and anticipate a reversal in price direction.
Simplified Dow theory
A simplified interpretation of Dow Theory is often used to identify trend reversals in financial markets and can be used also in trading market reversals in gold. This concept focuses on specific price patterns that signal potential reversals. Here's a brief explanation of this aspect of Dow Theory.
In Dow Theory, the concept revolves around the idea that trends in financial markets, such as gold, progress through distinct phases. In an uptrend, prices tend to make a series of higher highs and higher lows, indicating sustained buying pressure and optimism among investors. This pattern suggests that the demand for gold is strong.
The crucial sign of a reversal
However, when the market reaches a point where it fails to establish a new higher low and instead forms a lower high, it can be a sign that the trend is losing momentum. This violation of the previous higher low is seen as a crucial event, often signalling a potential trend reversal. It suggests that buying interest could be drying up and sellers may be gaining strength. In other words, the market sentiment could be shifting from bullish to bearish.
Traders often use this violation of the last higher low as a trigger to consider either a partial or full exit of long positions, anticipating that the market may be ready to reverse direction. It's important to note that additional technical analysis tools and confirmation are typically used in conjunction with this concept to increase the likelihood of making accurate trading decisions.
Dow Theory's price pattern interpretation in uptrends highlights the significance of the last higher low being violated and a lower high forming as an early warning signal for a potential trend reversal in financial markets.
The role of demand and supply during up trends
During uptrends in the financial markets, the dynamics of demand and supply undergo notable changes, primarily driving the market's upward trajectory. New traders are often too eager to anticipate a trend reversal and end up betting against the trend.

One of the key reasons for the market creating higher lows is the upward shift in demand. In this phase, traders and investors demonstrate a willingness to purchase at higher prices than before. This increased demand signifies a growing confidence in the asset's value, leading buyers to enter the market at these elevated levels.
The formation of higher lows indicates a robust demand that outpaces supply at each successive low point, reflecting the market's strength and the bullish sentiment of participants.
Supply shortfall leading to new highs
The market's break into new highs is primarily due to supply being weaker than demand. When an asset reaches new high points, it suggests that the available supply is insufficient to meet the escalating demand. Sellers are unable to maintain control, and as a result, prices push upwards, breaching previous resistance levels and setting new highs. This imbalance, with demand overpowering supply, fuels the continuation of the uptrend.
As traders observe the creation of higher reactionary lows, indicating that demand has moved higher, they often start adjusting their strategies. Recognizing the strength in demand, they may withdraw their sell offers, effectively reducing the supply further. In some cases, these traders might even transition from being sellers to joining the buyers, adding to the demand side.
This behavioural change among traders, is the defining factor between uptrends and bearish trend reversals as it contributes significantly to the sustaining of the uptrend. It reinforces the demand and weakens the supply, propelling prices even higher and maintaining the uptrend.
The role of demand and supply during bearish reversals
Market reversals are critical turning points in the financial markets, often precipitated by institutional profit-taking for various reasons, typically fundamental in nature. This profit-taking begins to weaken the market, leading to one of two significant events: the breaking of a key support level or the creation of a lower reactionary high.
When a lower low and a lower reactionary high are formed, it indicates that investors and traders are actively distributing their holdings, which increases the supply of gold contracts in the market. This action is not merely about selling off holdings; it often signals a shift in market sentiment and could lead to a trend reversal.
Investors and traders might be positioning themselves for a potential downtrend, sometimes even going as far as taking short positions in anticipation of further market decline. The creation of a lower reactionary high is a clear sign of changing market dynamics, where the previously dominant buying interest is starting to wane, leading to an increase in supply.
Breaking Key Support Levels
The breaking of a key support level is another telltale sign of a market reversal. Support levels are price points where historically, demand has been strong enough to prevent the price from falling further. However, when such a level is broken, it signifies a significant change in market sentiment.
It indicates that traders and investors are no longer inclined to pay higher prices for the asset, pointing to a weakening in demand. This breakdown of support levels can trigger a rapid shift in market dynamics, as it often leads to an accelerated selling pressure. The break of a key support level confirms that the bullish sentiment which was driving the uptrend is losing its strength, and a bearish sentiment is likely taking over, potentially leading to a sustained downward trend in the market.
Trend reversal types
Not all the trend reversals are similar. Therefore, it's vital traders know the most typical reversal formations. Here are some key types of market reversals:
1. U-Reversals
U-reversals unfold gradually, forming a rounded bottom (for bullish reversals) or a rounded top (for bearish reversals). These patterns suggest a more sustainable and long-term change in market direction compared to e.g. V-reversals. U-reversals typically indicate a gradual shift in sentiment among market participants.

In U-reversals, the gradual shift in price direction reflects a more nuanced change in demand and supply. For bullish U-reversals, the initial downward trend indicates excess supply over demand. However, as the market reaches its nadir, demand slowly begins to build, often unnoticed at first.
This incremental increase in buying interest, coupled with a decrease in selling pressure, gradually balances and then overcomes the existing supply. The rounded bottom formation is a result of this sustained shift in market sentiment, where demand consistently outpaces supply, leading to a gradual but steady price increase.
Conversely, bearish U-shaped trend reversals start with an oversupply being gradually overtaken by increasing demand, forming a rounded top. These patterns reflect a more deliberate and sustained change in market dynamics, often aligned with long-term fundamental shifts.
2. Double top and bottom reversals
Double top and bottom patterns involve two peaks (double top) or troughs (double bottom) occurring at specific price levels. These patterns are used to predict trend reversals. A double top is seen as a bearish reversal signal when the price breaks below the intervening trough, while a double bottom pattern signals a bullish reversal when the price rises above the intervening peak. Traders watch these patterns closely for potential shifts in market direction.

In Double Top and Bottom Reversals, the twin peaks or troughs represent critical points in the struggle between supply and demand. In a double top pattern, the first peak occurs when demand drives prices up, but reaches a level where supply begins to dominate, causing prices to drop.
The subsequent rise to form the second peak is typically due to residual buying interest, but if this peak fails to surpass the first, it suggests that demand is weakening and supply is gaining strength. The confirmation of a bearish reversal comes when prices break below the intervening trough, indicating a significant shift towards supply dominance.
Double Bottom Pattern
Conversely, in a double bottom pattern, the initial trough represents a point where supply overwhelms demand, leading to a price drop. The rebound to form the second trough is often due to sellers taking profits or a reduction in selling pressure. If the second trough fails to go lower than the first, it suggests diminishing supply and strengthening demand.
The bullish reversal is confirmed when prices rise above the intervening peak, indicating a shift in market sentiment where demand is now overpowering supply, potentially leading to an upward trend. This pattern illustrates the tug-of-war between buyers and sellers and is a vital tool for traders in predicting significant shifts in market direction.
3. Triple bottom trend reversals

In Triple Bottom Trend Reversals, the formation of three consecutive troughs at similar price levels is indicative of a sustained demand. Initially, each trough represents a point where selling pressure has driven prices down, but not sufficiently to break through a certain support level, hinting at a latent, building demand.
As the pattern progresses, each successive trough suggests that sellers are unable to push prices lower, indicating a weakening supply. The consistent failure to breach the support level points towards an exhaustion of selling pressure.
Transition to Bullish Sentiment
This pattern is a strong signal that buyers are gradually gaining strength. The resilience of the support level, tested three times, demonstrates a growing demand that is beginning to counterbalance and eventually overpower the existing supply. The bullish reversal is confirmed once the price moves decisively above the resistance level formed by the previous troughs.
This shift signals that demand has successfully overtaken supply, suggesting a potential end to the downtrend and presenting traders with a buying opportunity as they anticipate an upward price movement. The triple bottom pattern, therefore, serves as a key indicator for traders to identify turning points in the market where a prolonged bearish sentiment is giving way to a bullish trend.
4. V-Reversals
V-shaped trend reversals are characterized by a sudden and sharp change in price direction, resembling the letter 'V' on the price chart. These reversals often occur in response to significant news events, policy changes, or market overreactions. They signify a rapid shift in market sentiment, and traders must act swiftly to capitalize on these opportunities or protect their positions.

In V-reversals, the sudden change in price direction is driven by a stark shift in demand and supply dynamics. Initially, a steep decline indicates strong selling pressure, overwhelming demand. However, the reversal point, typically prompted by impactful news or market recalibration, marks a rapid influx of demand.
Market sentiment shifts
This sudden increase in buying interest, often due to traders and investors perceiving the asset as undervalued, quickly outpaces supply, propelling prices sharply upwards. The key in these scenarios is the velocity at which market sentiment shifts, causing a rapid turnaround in price action and creating opportunities for astute traders to quickly adapt to the new market direction.
Understanding these different types of trend reversals is crucial for traders as it helps them identify potential opportunities and risks in the financial markets and make informed decisions based on market sentiment and technical analysis.
Trend reversal examples in gold
U-Shaped Trend Reversal in September 2018
In September 2018 real interest rates, adjusting for inflation, seemed to have peaked, reducing the opportunity cost of holding non-yielding assets like gold. Furthermore, increased equity market volatility, reflected in a doubled VIX Index, contributed to gold's rally, as it's considered a safer investment during turbulent times.

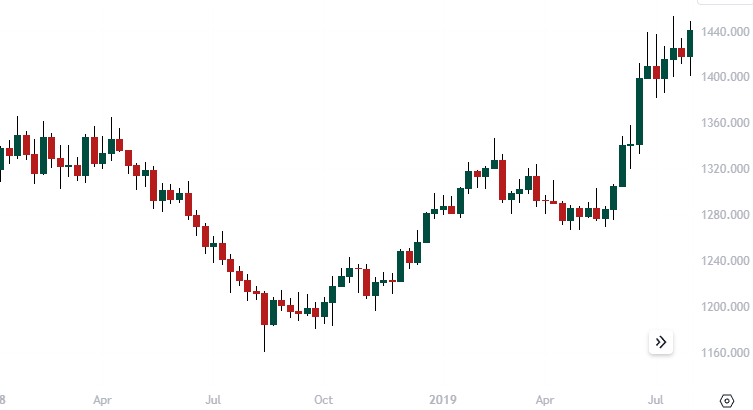
A double bottom trend reversal in March 2021
The March 2021 gold market rally was driven higher by rising inflation expectations, stemming from central bank policies. Robust retail demand in countries like India and China, for both jewellery and investments, further boosted prices. Central banks continued to increase their gold reserves, affirming its safe-haven status.
Furthermore, Gold saw renewed interest, with investors drawn by rising prices, inflation concerns, a weaker US dollar, and lower real yields. The broader economic context, marked by recovery from the pandemic-induced slowdown, also influenced gold's performance.

Triple bottom trend reversal in October 2022
The October 2022 gold market rally was underpinned by the weakening US dollar, as gold typically rises when the dollar falls. Moreover, expectations of lower real interest rates, coupled with central banks like China and Russia increasing their gold holdings for diversification, added to the rally.
Additionally, the resurgence of investment flows into gold exchange-traded funds (ETFs) highlighted renewed investor interest in gold as a strategic asset class. These factors converged to drive the robust gold market performance in Q4 2022.
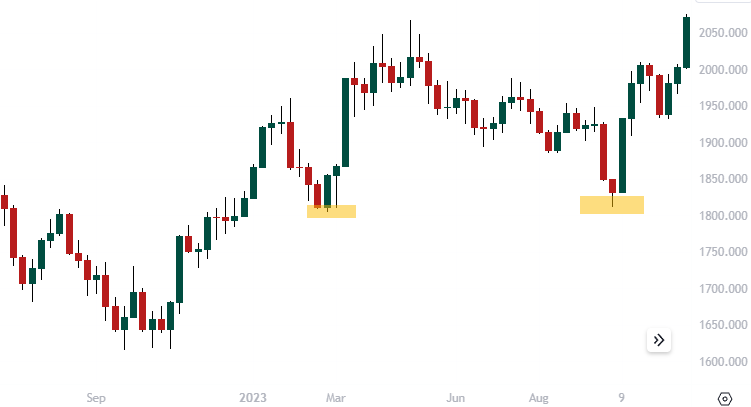
V-shaped market trend reversals in February and October 2023
The gold market rally in October 2023 was influenced by several factors. Geopolitical tensions, notably in Israel, heightened global uncertainty, driving investors towards the traditional safe haven of gold. Simultaneously, economic worries and volatility in the stock market, with the S&P 500 entering correction territory, further boosted gold's appeal.
Central banks significantly increased their gold purchases, with a record quantity acquired in Q3 2023. Additionally, shifts in investment trends, evident in futures and ETF markets, showed a renewed interest in gold. These combined elements led to a substantial increase in gold prices during the month.
Conclusion
understanding trend reversals in financial markets is essential for us as we are constantly seeking profitable trading opportunities. Recognizing the different types of reversals, such as U-reversals, Double Top and Bottom patterns, Triple Bottom Reversals, and V-Reversals, provides valuable insights into market sentiment and potential shifts in price direction.
These patterns serve as crucial indicators for traders to make informed decisions and adapt their strategies accordingly.
Whether you're a seasoned trader or just starting, our user-friendly platform provides the resources and features you need. To get started on your path to success with mean reversion trading, simply visit our account opening page to open your trading account with us.
Real-life examples, like the U-shaped reversal in September 2018, the double bottom reversal in March 2021, the triple bottom reversal in October 2022, and the V-shaped market reversals in February and October 2023, demonstrate how various factors, including economic conditions, geopolitical events, and central bank actions, can influence trend reversals in the gold market.

Risk disclaimer: CFDs are complex instruments and come with a high risk of losing money rapidly due to leverage. You should consider whether you understand how CFDs work and whether you can afford to take the high risk of losing your money. Never deposit more than you are prepared to lose. Professional client’s losses can exceed their deposit. Please see our risk warning policy and seek independent professional advice if you do not fully understand. This information is not directed or intended for distribution to or use by residents of certain countries/jurisdictions including, but not limited to, USA & OFAC. The Company holds the right to alter the aforementioned list of countries at its own discretion.
Join us on social media

Janne Muta holds an M.Sc in finance and has over 20 years experience in analysing and trading the financial markets.