The Ultimate List of Technical Indicators on MT4 and MT5
BY Chris Andreou
|พฤศจิกายน 2, 2566Here is a list of technical indicators for the MetaTrader 4 (MT4) and MetaTrader 5 (MT5) trading platforms. These are two of the most popular foreign exchange (Forex) trading platforms on the market today. Because they are easy to use and come equipped with a vast list of technical indicators to assist in your decision making.
So in this article, I have compiled the ultimate list of technical indicators that come built in to both platforms. Although there are fewer technical indicators on MT4, both platforms will be covered. I will also explain what the technical indicators show and why traders use them.
Let's get started.
The List of Technical Indicators
That can be found on the MT4 and MT5 trading platforms
1. Moving Averages (MA)
These help to identify a market's trend direction. Two most common types of moving averages are Simple Moving Average (SMA) and Exponential Moving Average (EMA).
The SMA is the sum of all closing prices over a period of time divided by that period. The EMA takes into account more recent prices, giving them greater weight in the calculation and making the EMA more adaptive.
Moving averages are the most basic technical analysis tool used in trading strategies. They can help you identify if a trend is present in a market and whether it’s bullish or bearish.

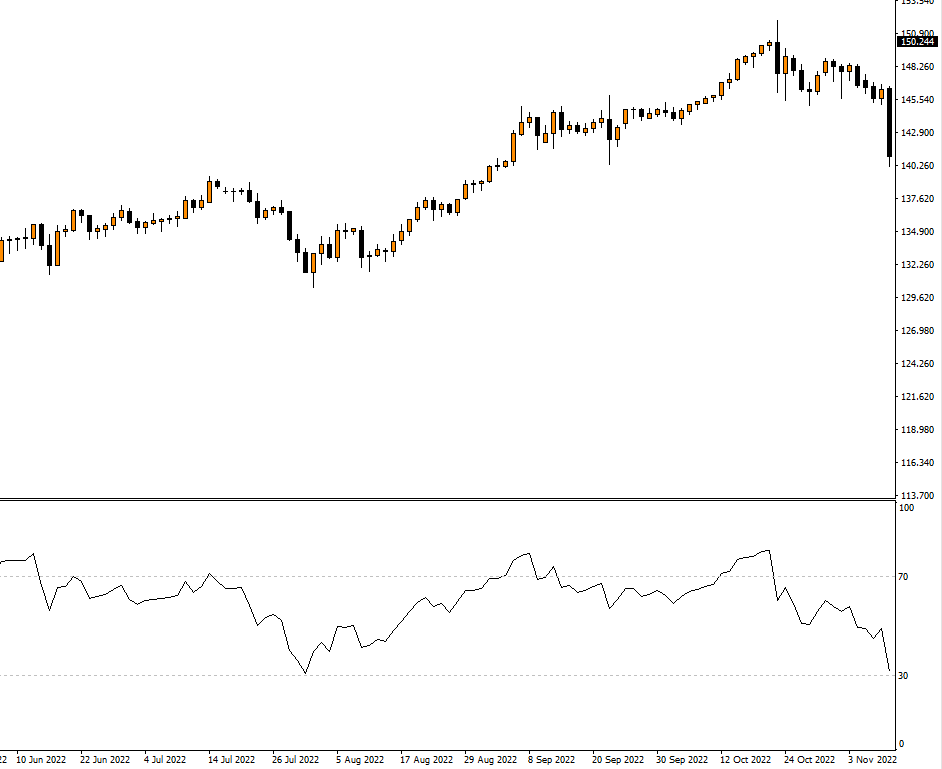
2. Relative Strength Index (RSI)
RSI measures the strength or weakness of an instrument or market based on the closing prices of recent trading intervals. It also measures momentum and oscillates between zero and 100. Usually, values of 70 and above indicate overbought conditions, and values of 30 and below suggest oversold conditions.
The relative currency strength is a popular technical analysis indicator helping you to identify potential turning points in price.
3. Bollinger Bands (BB)
Create by and named after Daniel Bollinger, this indicator comprises a moving average line and two lines plotted at two standard deviations from the moving average.
Bollinger Bands essentially envelopes price and adjust to price volatility. When the bands contract, volatility is low and when they expand, volatility is high. This indicator can help you identify price trends as well as potential turning points when price approaches and closes outside the bands.

4. Stochastic Oscillator
This momentum indicator compares a particular closing price of an instrument or market to a range of its prices over a certain period of time. Its values range between zero and 100.
The Stochastic Oscillator can be very useful in determining overbought or oversold conditions. When the value of this technical indicator is above 80%, it indicates that prices may be overbought. When the value drops below 20%, it indicates that prices may be oversold. Meaning price may be due for a correction.

5. Moving Average Convergence Divergence (MACD)
MACD helps identify changes in strength, direction, momentum, and the duration of a trend. The MACD is made up of two lines: a fast line and slow line. The fast line is based on the difference between two exponential moving averages (EMAs). The slow line is a simple moving average of the difference between these EMAs.
MACD is a trend-following momentum based technical indicator that provides signals when the fast line crosses the slow line. The two lines are used to determine whether bullish or bearish trends are present in the market. When the MACD histogram is above zero, this indicates a bullish trend and when it’s below zero, this indicates a bearish trend.

6. Average True Range (ATR)
This volatility indicator is used to read market volatility by showing how much an instrument moves, on average, during a given period of time.
The ATR is calculated by taking the true price range of an instrument over a series of time intervals and dividing it by the number of intervals in the period. It can help you determine an instruments average price ranges so you can gauge volatility. With that, you can get a better idea, on average, how far the price can potentially move for any given time interval.

7. Ichimoku Cloud
This is a comprehensive indicator that provides many data points, that can help you analyze current and future price trends. The Ichimoku Cloud is unique in that it is designed to provide a complete picture of the market, showing support and resistance levels, momentum, and trend direction.
The Ichimoku Cloud consists of five lines or components creating a "cloud" where the interplay between these components helps in identifying trading signals.

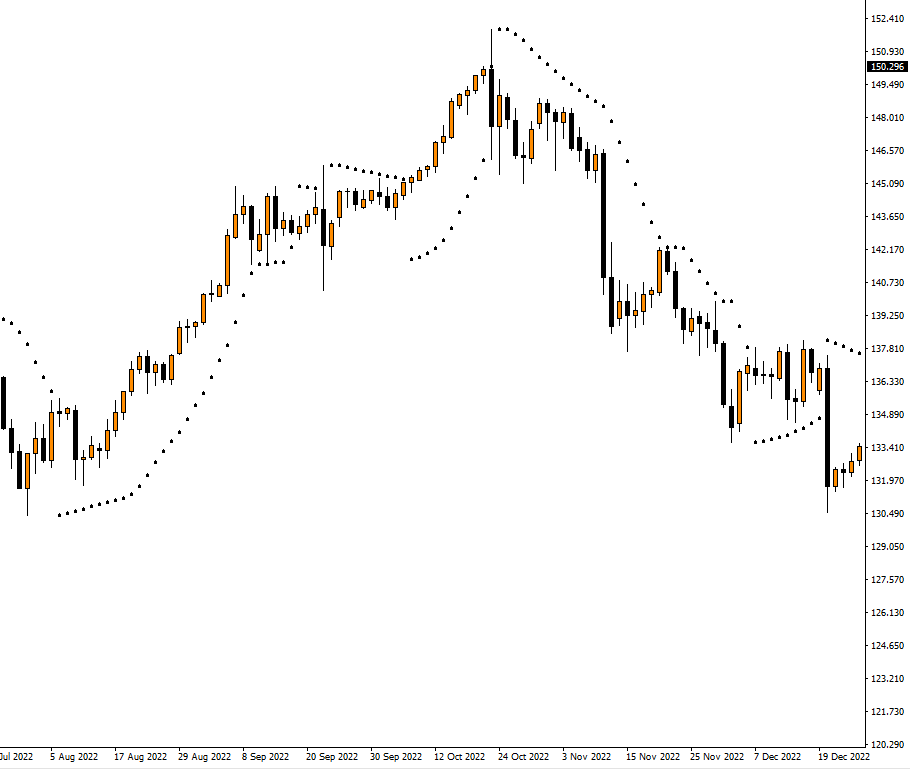
8. Parabolic Stop And Reverse (Parabolic SAR)
This technical indicator is frequently used in mechanical trading systems to estimate trend direction and price momentum. It employs a trailing stop level above or below price to indicate when there is a higher than normal probability of the price continuing its trend or switching directions.
In this sense, it helps traders identify entry and exit points and when it might be a good time to stop and reverse the trading bias.
9. Bulls And Bears Power
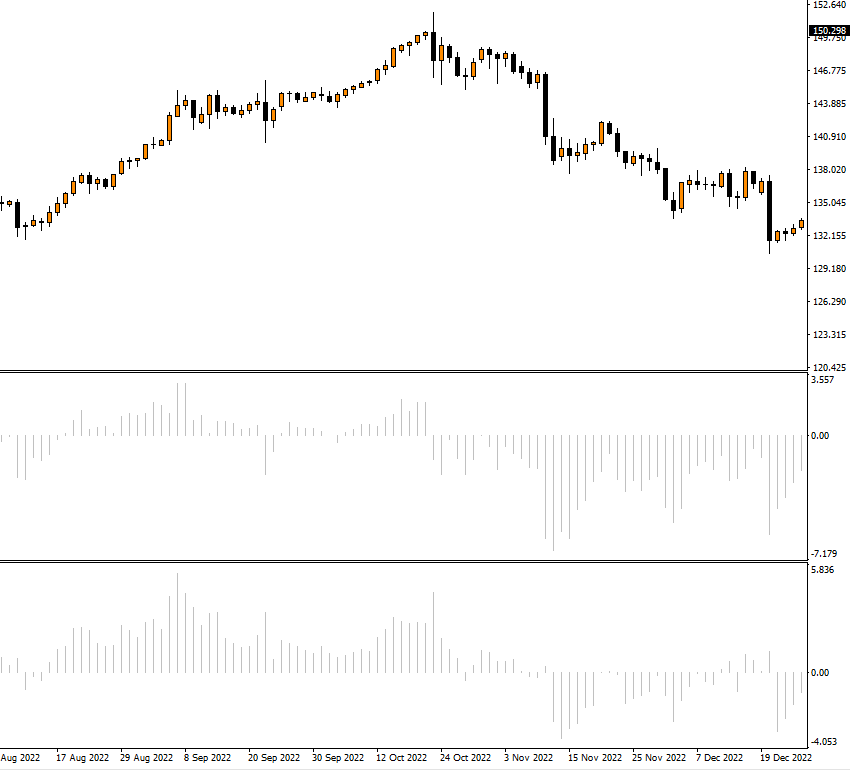
This technical indicator was developed by Dr. Alexander Elder to measure the buying or selling strength or "power" in the market. It is a pair of indicators providing insights in to the capability of buyers and sellers to drive prices in their favour.
If the bulls or bears power is above or below zero, they are commonly and simply interpreted as a bullish or bearish signals. You can also estimate when buying or selling strength is increasing or decreasing.
10. Force Index
The Force Index is another technical indicator developed by Dr. Alexander Elder and it is a tool that aims to quantify the driving force behind price movements.
The Force Index is an oscillator type of indicator, which means it fluctuates between positive and negative values. A positive Force Index indicates that buyers were more influential in driving price changes. Whereas a negative Force Index suggests that sellers exerted more strength.

11. Commodity Channel index (CCI)
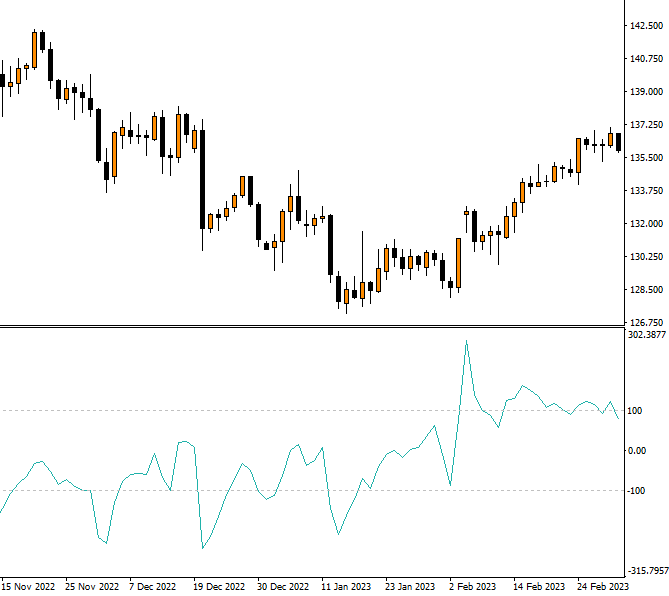
This technical indicator, was created by Donald Lambert and introduced in Commodities magazine in 1980. The CCI is a versatile oscillator designed to measure the current price level relative to an average price level over a given period of time.
Typically, when the CCI is above zero, it indicates an upward trend. Whereas a CCI reading below zero suggests a downward trend. It's used to spot potential reversals or areas where an instrument is overbought or oversold. When this technical indicator is above 100, it indicates overbought conditions. Below 100, it indicates an instrument might be oversold.
12. Money Flow Index (MFI)
The MFI combines both price and volume data to generate overbought or oversold signals. It measures the flow of money into and out of a security over a specified period of time.
Created by Gene Quong and Avrum Soudack, the MFI is also known as volume-weighted Relative Strength Index (RSI). An MFI value above 80 is typically considered overbought. While values below 20 are generally considered oversold.

13. Volume
The volume indicator in technical analysis is a vital tool that investors and traders use to understand liquidity and market activity when trading financial instruments.
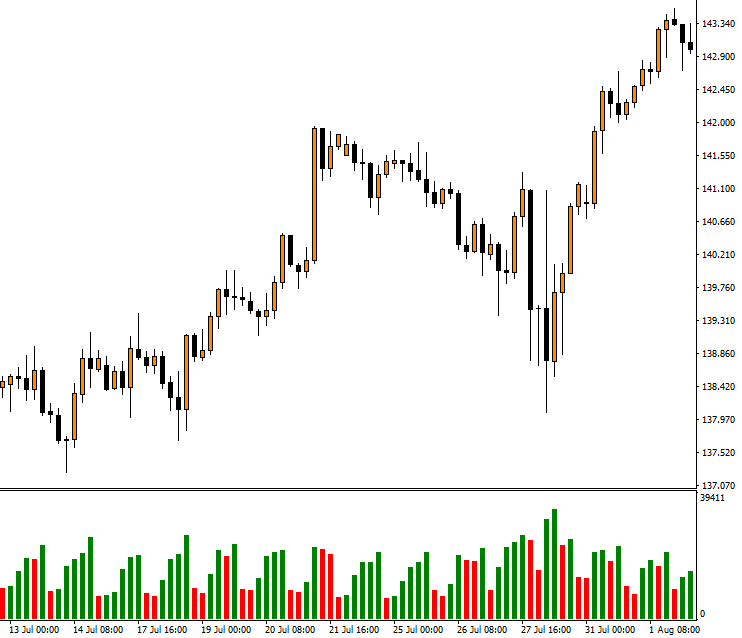
Trading volume measures the number of shares, contracts or lots traded during a specific period of time. Providing insights into buying and selling pressure in the market. Volume is more informative when considered in combination with other technical indicators such as price movement and patterns.
Its important to note that accurate volume data for Forex is not possible to obtain due to the decentralized nature of the market. Instead, this technical indicator displays tick volume for Forex. It counts the number of price ticks in a given time interval.
14. Fractals
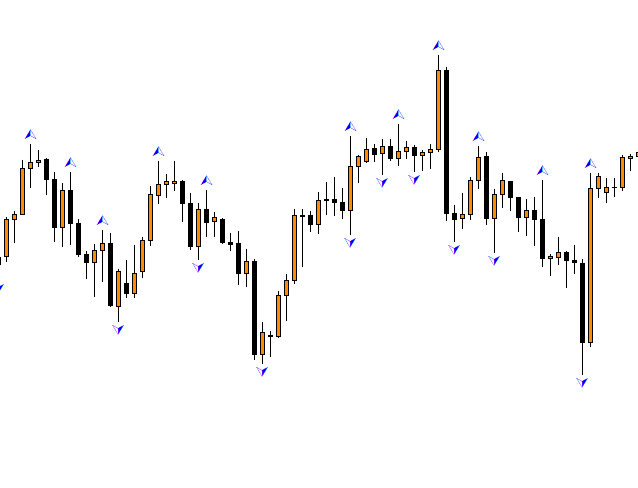
This tool or price pattern is used for identifying potential turning points in the market. The Fractal pattern consists of five bars or candlesticks and predicts these reversals by identifying instances when the price makes swing highs or lows.
In a Fractal pattern, the central bar or candlestick has the highest high or lowest low. With two lower highs either side of it for a swing high or two higher lows either side of it for a swing low. It can be used to provide trading signals and indicates potential entries and exits for trading.
15. Heiken Ashi
The Heiken Ashi technical indicator is a different approach to Japanese candlestick charts. It is designed to filter out some of the market noise, making it easier to identify and analyze price trends.
In comparison to traditional Japanese candlestick charts, which utilize the opening, high, low, and closing prices. The Heiken Ashi charts employ an average pricing system that helps to filter out the noise and visually indicate what the price trend is.

16. Awesome Oscillator (AO)
The Awesome Oscillator (AO) is a momentum indicator used in technical analysis to measure market momentum. Developed by financial analyst, Bill Williams, the AO calculates the difference between a 34 period and 5 period simple moving averages.
The Awesome Oscillator is displayed as a histogram anchored around a zero line. This configuration allows the AO to help traders gauge the strength of market trends and potential reversals.

How to add technical indicators to MT4 or MT5
The best way to learn how to use the technical indicators on this list is by testing them. Register and create your trading account, then download and log in to the MT4 or MT5 trading platform.
- Log in to MT4 or MT5
- Click the insert menu at the top of the trading platform
- Hover over the indicators option
- Find and select the technical indicator you want to add

You can change the parameters of the technical indicator by right-clicking on the technical indicator and selecting properties from the pop-up menu that appears.
Final words on technical indicators
This list of technical indicators is not exhaustive. There are many others that traders use for their technical analysis and trading strategies.
Technical indicators should be used in combination and with other forms of analysis to make them more effective. The key to using technical indicators is to understand what they’re telling you and how that information can be used to make informed trading decisions.
Many of these technical indicators will generally be telling you the same thing. For example, oscillating indicators are similar to each other and so are trending indicators.
To get the best results, you should pick one oscillating indicator and one trending indicator. The latter can help you formulate a directional bias. While the former can help identify overbought and oversold conditions for potential entries and exits.
Would you like to give them a try?
Take your knowledge further with TIOmarkets
This is where education meets excellence, take your knowledge further with our suite of educational resources and sign up to our free forex trading course. Then put your knowledge to the test on a demo or live trading account.
With TIOmarkets, you can trade more than 300+ instruments in the forex, indices, stocks, commodities and futures markets, all with low fees and fast order execution speeds.
Whether you are a beginner or experienced traders, we are committed to providing you with 24/7 customer support and the tools you need to trade effectively.
Register your account with TIOmarkets today.

Risk disclaimer: CFDs are complex instruments and come with a high risk of losing money rapidly due to leverage. You should consider whether you understand how CFDs work and whether you can afford to take the high risk of losing your money. Never deposit more than you are prepared to lose. Professional client’s losses can exceed their deposit. Please see our risk warning policy and seek independent professional advice if you do not fully understand. This information is not directed or intended for distribution to or use by residents of certain countries/jurisdictions including, but not limited to, USA & OFAC. The Company holds the right to alter the aforementioned list of countries at its own discretion.
Join us on social media

Experienced independent trader
Related Posts


