logo

Trade Indices CFDs

Trade indices from the US, UK, Europe, Asia and Australia

Start Trading

下一步

Hero Image

INDICES FROM

US, UK, EU & ASIA

TRADE FROM

$0 COMMISSION

UP TO

1:100 LEVERAGE

10+

INDICES

INDICES FROM

US, UK, EU & ASIA

TRADE FROM

$0 COMMISSION

UP TO

1:100 LEVERAGE

10+

INDICES

INDICES FROM

US, UK, EU & ASIA

TRADE FROM

$0 COMMISSION

UP TO

1:100 LEVERAGE

10+

INDICES

Trade global stock market indices

Forex
Indices
Commodities
Stocks
Futures

Bid

Ask

Spread

Tiomarkets Logo

*本頁價格僅供參考。流動性較低的工具,如但不限於外來貨幣對、股票和指數,其價格不像一般交易工具那樣經常更新。請查看您的MT4/MT5平台內的最新即時價格

What are indices?

Indices represent a collection of stocks organised by industry sector or country with their aggregate performance being tracked. Indices are particularly useful for monitoring the broader stock market's general performance. As well as providing a singular tradable instrument for gaining exposure in all the indices constituent stocks.

Currencies logo

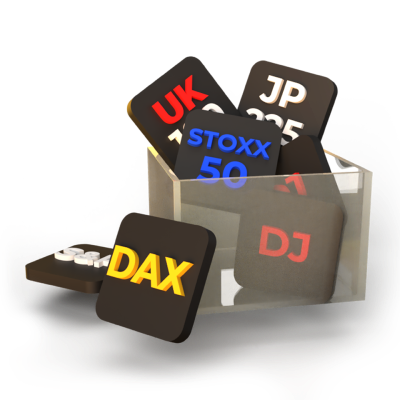
Popular indices include

S&P 500

S&P 500

Symbol: S&P500

An index composed of 500 large US companies, representing the overall US stock market.

Dow Jones

Dow Jones

Symbol: DJ

An index that tracks 30 large publicly-owned U.S. companies.

Nasdaq

Nasdaq

Symbol: NAS

An index that includes all the stocks listed on the NASDAQ stock exchange. The Nasdaq is heavily influenced by the technology sector.

FTSE 100

FTSE 100

Symbol: UK100

An index representing the 100 largest companies listed on the London stock exchange in the UK.

DAX

DAX

Symbol: DE30

An index of the major German companies listed on the Frankfurt Stock Exchange.

Euro Stoxx 50

Euro Stoxx 50

Symbol: STOXX50

An index of Europe's leading blue-chip companies from 12 Eurozone member states.

IBEX 35

IBEX 35

Symbol: ESP35

A Spanish stock market index comprising 35 of the most liquid stocks traded on the Madrid stock exchange.

ASX 200

ASX 200

Symbol: AUS200

A benchmark index of the top 200 companies listed on the Australian securities exchange.

Nikkei 225

Nikkei 225

Symbol: JP225

A stock market index representing 225 large Japanese companies listed on the Tokyo stock exchange.

Hang Seng Index

Hang Seng Index

Symbol: HK50

An index representing 50 largest and most liquid companies listed on the Hong Kong stock exchange.

How Indices trading works

Indices trading allows you to trade on the performance of a group of stocks without needing to buy shares in each individual company. If you think the value of the index is likely to rise, you can simply buy the index. If you think the value of the index is likely to fall, you can sell it.

card img

Bid and ask prices

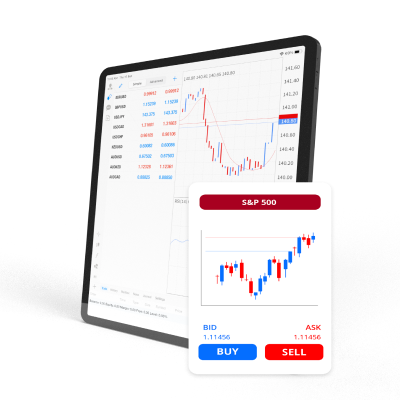
Each indice is quoted with two prices, the 'Bid' price and the 'Ask' price. The bid price is the price at which you can sell the indice. While the ask price is the price at which you can buy it. The ask price is always higher than the bid price and the difference between these prices is called the 'Spread'.
card img

做多或做空

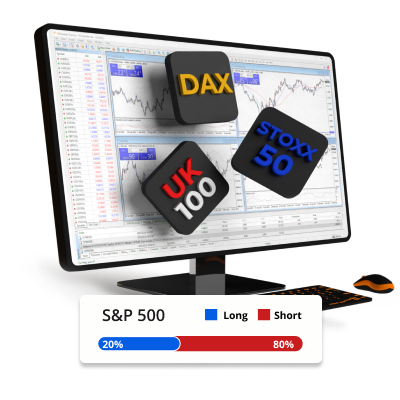
The basic idea is to buy (go long) when you think the indice will appreciate in value and sell (go short) when you think it will depreciate in value. Just like buying something at a lower price and trying to sell it at a higher price to profit. You can trade indices long or short, meaning that you can trade rising as well as falling prices.
card img

Indices are traded in lots

When trading indices, trades are placed in terms of lots. Where one lot is usually the equivalent to trading 10 indices contracts. You can also trade mini lots (1 indices contract) or micro lots (1/10th of an indices contract). Check our contracts specifications page to learn more about indices lot sizes.
card img

Indices trading involves leverage and margin

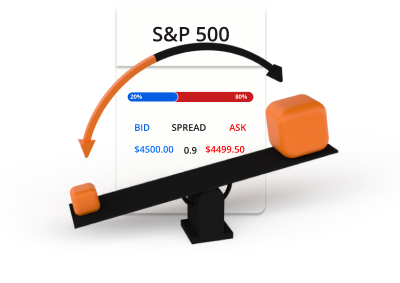
Indices trading involves using leverage, which allows you to place trades of a much larger value than the amount you have in your trading account. For example, trading with 100:1 leverage would allow you to buy 1 indices contract at only 1% of its current market value. Leverage can magnify potential profits but it also increases risk and speeds up losses.

Indices trading example

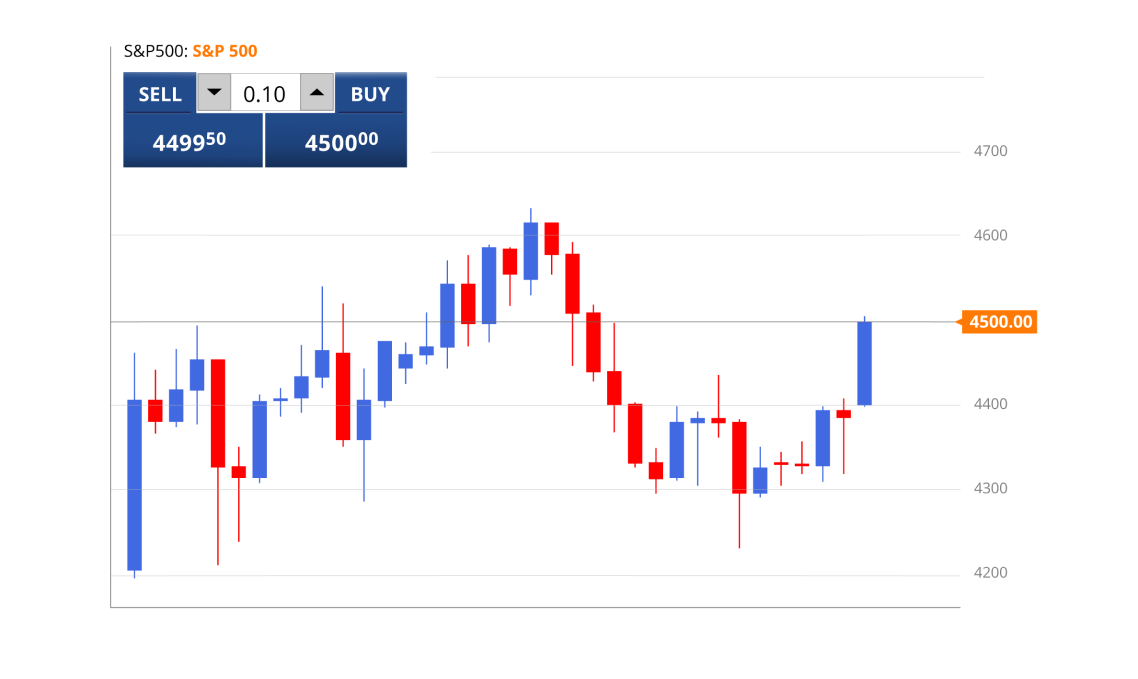
You decide to buy 0.1 lots of the S&P500 at 4500 using 100:1 leverage.

chart
Trade size:

10 indices contracts x 4500 = USD 45,000

Position value:

USD 45,000

Margin requirement:

USD 45,000 / 100 = USD 450

Now you have opened a long position in the S&P500 worth USD 45,000. Since indices are traded using leverage, only $450 was used as margin from your trading account. After some time, the price of the S&P500 moves and you decide to sell.

Scenario 1

chart

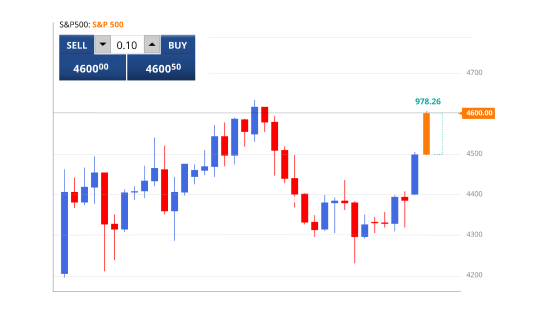
The S&P500 moves up from 4500 to 4600 and you decide to sell.

This is how the profit or loss on the trade would be calculated.

P/L = (Current price - Initial price) x Position value / Current price

P/L = ((4600 - 4500) x 45,000) / 4,600

(100 x 45,000) / 4,600

P/L = 978.26

Scenario 2

chart

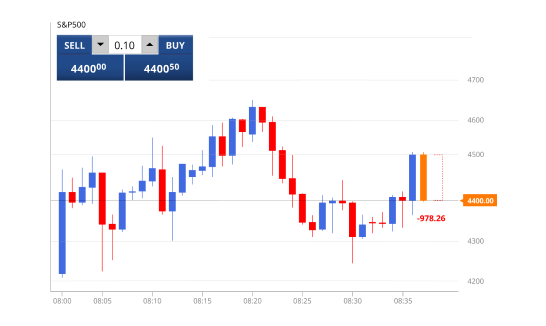
The S&P500 moves down from 4500 to 4400 and you decide to sell.

This is how the profit or loss on the trade would be calculated.

P/L = ((Current price - Initial price) x Position value) / Current price

P/L = ((4400 - 4500) x 45,000) / 4,400

P/L = (-100 x 45,000) / 4,600

P/L = -978.26

Trading central banner

極具價值的交易與優質服務

這就是像您這樣的人選擇TIOmarkets的原因

benefit icon

點差從0.4個點開始

我們的聚合式流動性可在大部分時間內保持低點差

benefit icon

零佣金

Trade from $0 per lot on our VIP Black or spread-only trading accounts

benefit icon

啟動量低

Open your account from just $20 to start trading

benefit icon

24/7 customer support

We are here to help, with 3 seconds average response time on live chat

benefit icon

快速訂單執行

交易大部分時間在數毫秒內執行,滑點極低

benefit icon

300 +的符號

任何時候,隨時隨地交易外匯,股票,指數和商品市場

benefit icon

可靠的平台

在MT4和MT5電腦端或移動端交易平台交易全球金融市場

benefit icon

微型手交易

交易佣金低至每基點0.10美元,小賬戶的完美選擇,更好地管理您的風險

Trade on the MT4 trading platform

從您的桌面、互聯網瀏覽器或行動設備

devices image

了解有關與Tiomarkets交易的更多信息

24/7 Live Chat

undefined