Oil Technical Analysis | Oil recovery signals first weekly gain in five weeks
BY Janne Muta
|November 24, 2023Oil technical analysis - The price of oil has started to recover after trading lower since September. The Wall Street Journal has attributed the weakness in oil prices to a manufacturing slowdown in Europe and the U.S., a shaky economic outlook in China, a strong U.S. dollar, and ample oil supplies keeping storage tanks full. As a result USOIL moved lower by approximately 23% since the September high (93.94) before recovering last week.
This week, however, West Texas Intermediate (WTI) looks likely to record its first weekly gain in five weeks. The gain could be a market reaction to the possibility of the Organization of the Petroleum Exporting Countries (OPEC+) agreeing on further supply cuts. Led by Saudi Arabia, OPEC+ is considering these cuts to balance the market into 2024.
According Reuters non-OPEC production growth is, however, expected to be robust. Brazil's Petrobras, for instance, is planning significant investments to increase its output. This move could further influence the global oil supply and pricing trends.
Oil bulls hope to see more demand in China but China's recent economic indicators have provided mixed signals for the oil markets. While the Caixin Manufacturing PMI indicated a contraction, potentially decreasing industrial oil demand, other aspects like robust growth in industrial production and retail sales might lead to increased oil demand.
Summary of This Oil Technical Analysis Report:
- After trading lower, the oil market has steadied above a bottoming formation created in the spring. If the market closes today above $75.72, this week will mark the first up week in five weeks. It also appears likely that this week's lowest low will be higher than the previous week's, indicating signs of market stabilization.
- The daily chart shows US oil moving above the top of the bear channel. The bullish breakout has been moderate but the market is no longer confined within the channel. Two days ago, the market formed a bullish rejection candle, suggesting it might be ready to move higher.
- Moving average-based oil technical analysis still shows the market in a downtrend, but with the 20-period moving average converging with the 50-period SMA. The stochastic oscillator has also formed a higher reactionary low, indicating that the downside momentum is waning and the market is attempting to reverse the recent downtrend. However, for this reversal to become a reality, the market needs to continue creating higher reactionary lows and break above key resistance levels, with $78.44 being the nearest.
Read the full Oil Technical Analysis report below.
Oil Technical Analysis
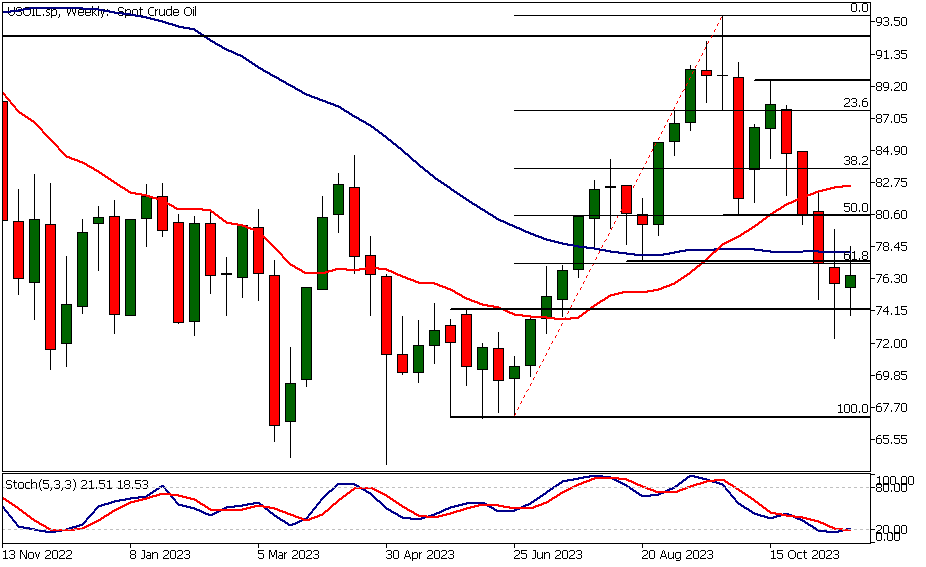
Weekly Oil Technical Analysis
After trading lower, the oil market has steadied above a bottoming formation created in the spring. If the market closes today above $75.72, this week will mark the first up week in five weeks. It also appears likely that this week's lowest low will be higher than the previous week's, indicating signs of market stabilization.
However, the nearest key resistance level on the weekly timeframe chart is relatively close at $80.62. This could lead to further consolidation before the market is ready to create a sustained uptrend. The nearest key support level is last week's low at $76.00.
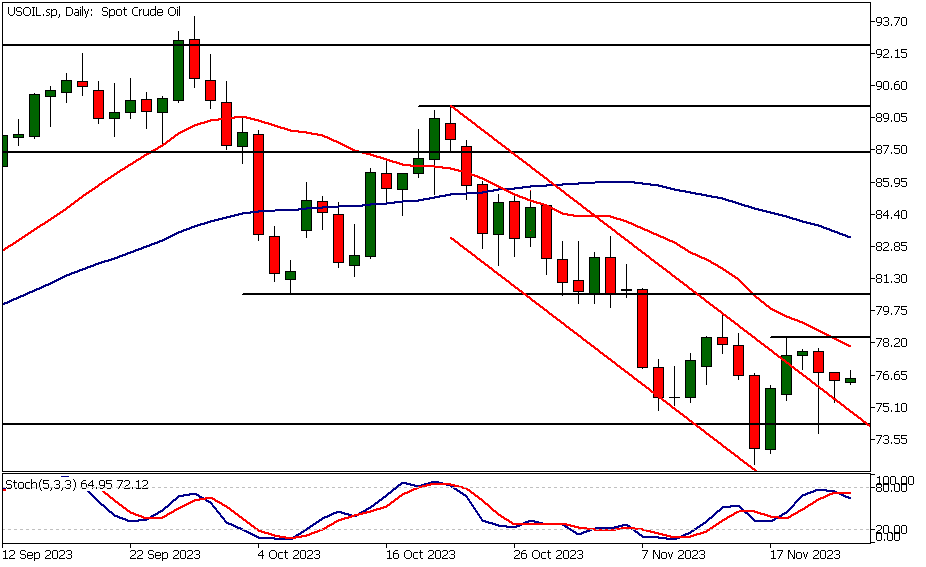
Daily Oil Technical Analysis
The daily chart shows US oil moving above the top of the bear channel. The bullish breakout has been moderate but the market is no longer confined within the channel. Two days ago, the market formed a bullish rejection candle, suggesting it might be ready to move higher.
However, due to the US Thanksgiving holiday, trading has been subdued with no follow-through buying yet. If the market breaks above $78.44, we could see it trading up to $80.62. Conversely, if selling pressure emerges, the market could drop back down to $73.82.
Stochastic oscillator sell signal
Current oil technical analysis indicates that the market remains in a downtrend, with the current market price below the 20-period moving average and the 20-period SMA below the 50-period SMA. Both moving averages are trending lower, and the stochastic oscillator has just issued a sell signal, suggesting lower prices ahead.
However, it's important to remember that it is the price that moves the indicators, not the other way around. Therefore, with the market trading close to a significant bottoming formation, the downside could be limited.
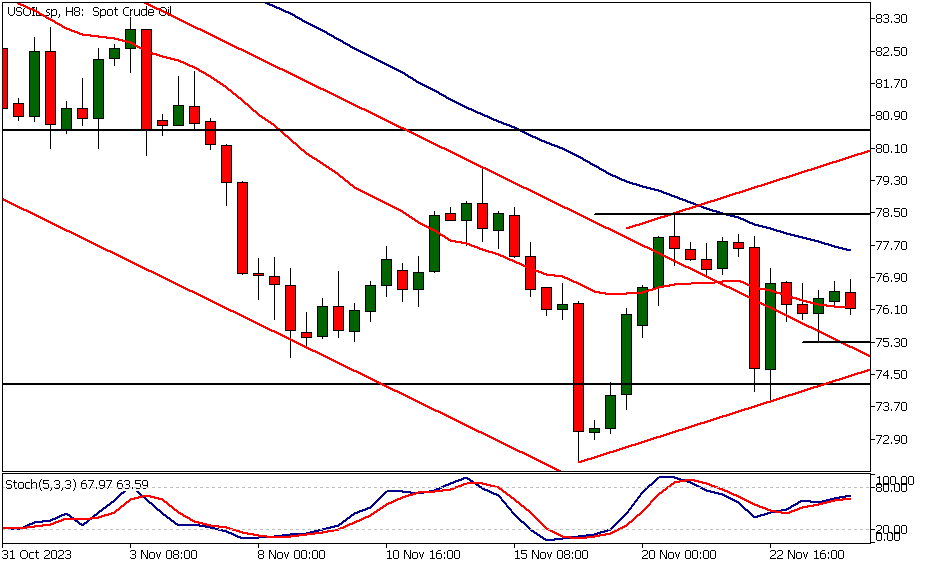
Oil Technical Analysis, 8h
Due to holiday trading in the US, there hasn't been much movement today. As such, the 8-hour chart presents a fairly similar technical picture to the daily time frame chart.
The nearest key support level is at $76.58, and the nearest key resistance level is at $78.44. Moving average-based oil technical analysis still shows the market in a downtrend, but with the 20-period moving average converging with the 50-period SMA.
Oscillator signals
The stochastic oscillator has also formed a higher reactionary low, indicating that the downside momentum is waning and the market is attempting to reverse the recent downtrend. However, for this reversal to become a reality, the market needs to continue creating higher reactionary lows and break above key resistance levels, with $78.44 being the nearest.
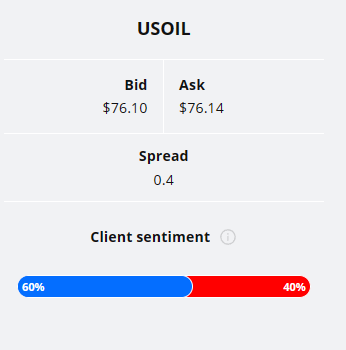
Client sentiment analysis
TIOmarkets' clientele are mildly bullish on USOIL, with 60% of clients holding long positions and only 40% shorting the market.
Please remember that the retail trader client sentiment is a contrarian indicator as most of the retail traders are on average betting against the market trends. This is why, experienced traders tend to trade against the retail client sentiment. You can follow the TIOmarkets client sentiment live on our Forex dashboard.
The next key risk events impacting this market
- US - Flash Manufacturing PMI
- US - Flash Services PMI
- US - S&P/CS Composite-20 HPI
- US - CB Consumer Confidence
- US - Richmond Manufacturing Index
- US - FOMC Member Waller Speaks
- US - Prelim GDP
- US - Oil Inventories
- US - Core PCE Price Index
- US - Unemployment Claims
- US - Chicago PMI
- US - Pending Home Sales
- US - ISM Manufacturing PMI
- US - ISM Manufacturing Prices
- US - Fed Chair Powell Speaks

Potential Oil Market Moves
If the market breaks above $78.44, we could see it trading up to $80.62. Conversely, if selling pressure emerges, the market could drop back down to $73.82.
How would you trade the Oil today?
I hope this Oil technical analysis helps you to make better informed trading decisions. Check the latest market analysis for other instruments and subscribe to receive them in your inbox as soon as they are published
DISCLAIMER: TIO Markets offers an exclusively execution-only service. The views expressed are for information purposes only. None of the content provided constitutes any form of investment advice. The comments are made available purely for educational and marketing purposes and do NOT constitute advice or investment recommendation (and should not be considered as such) and do not in any way constitute an invitation to acquire any financial instrument or product. TIOmarkets and its affiliates and consultants are not liable for any damages that may be caused by individual comments or statements by TIOmarkets analysis and assumes no liability with respect to the completeness and correctness of the content presented. The investor is solely responsible for the risk of his/her investment decisions. The analyses and comments presented do not include any consideration of your personal investment objectives, financial circumstances, or needs. The content has not been prepared in accordance with any legal requirements for financial analysis and must, therefore, be viewed by the reader as marketing information. TIOmarkets prohibits duplication or publication without explicit approval.

Janne Muta holds an M.Sc in finance and has over 20 years experience in analysing and trading the financial markets.
Related Posts
Trade responsibly: CFDs are complex instruments and come with a high risk of losing all your invested capital due to leverage.


