Silver Technical Analysis | The market trades at a weekly range low
BY Janne Muta
|November 9, 2023Silver Technical Analysis – Silver being an industrial metal has been under pressure lately as fears of global economic slowdown have increased. However, at the same time silver is expected to gain over the long term as the alternative energy boom.
Silver is needed in alternative energy production, particularly in the solar industry. As silver is a highly conductive metal it is used in solar panel cells to collect and transmit the electricity generated by sunlight. Each solar panel uses about 20 grams of silver and while the estimated numbers for growth in the number of solar panels vary the need for silver is bound to remain substantial.
The price of silver is also impacted by the price of gold. This is something short-term traders need to take into account. Over the last 12 months the silver to gold correlation has been as high as 78% and the probability for a price of silver moving higher when the price of gold rallies has been 37% over the same period.
Therefore, the price of silver could remain under pressure if the price gold doesn't catch a bid and start trading higher. The gold market is in decline at the time of writing this.
Summary of This Silver Technical Analysis Report:
- Silver is at a pivotal price after a strong rally and sideways movement, with a potential 4% swing to either reach weekly averages of 23.25-23.35 or drop to 21.57 depending on market support.
- Silver shows stabilization above 22.36 with indecisive market signals and a potential mean reversion play near range edges, awaiting a breakout for directional trading.
- The market shows potential for a higher swing low at 22.36, with possibilities of reaching 22.84 or even 23.30 if buying continues, or falling to previous lows if it doesn't.
Read the full Silver technical analysis report below.
Silver Technical Analysis
Weekly Silver Technical Analysis
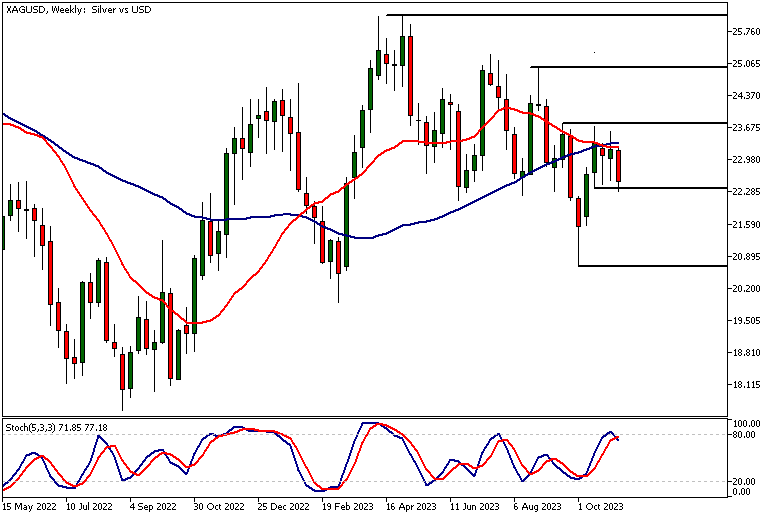
Silver is trading at a key price level. After rallying strongly, the market has been moving sideways for 3 weeks. Now the market is trading at the lower end of this weekly price range.
If the bulls re-engage with the market now and start pushing it higher, we could see it trading to the weekly moving averages at 23.25 - 23.35. Alternatively, if the support doesn't hold and there is a decisive break below the 22.36 support level, the market could trade down to 21.57. Therefore, we are looking at a 4% potential in either direction.
Daily Silver Technical Analysis
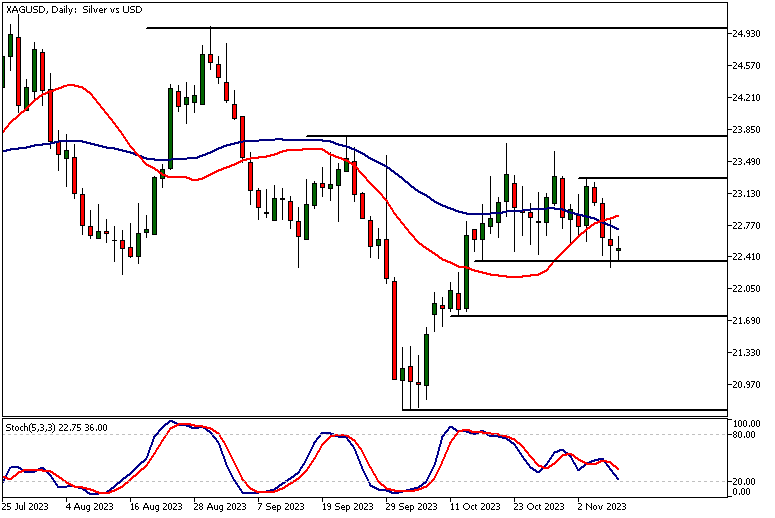
The daily chart shows how the silver market has stabilized above the 22.36 support level. Yesterday the price moved below this level momentarily but managed to close well above it. In the process, the market created a rejection candle with a long wick to the downside suggesting the silver bulls are willing to defend the 22.36 level.
However, yesterday's daily candle also has a long wick to the upside, signifying that the bulls were not able to maintain the rally and the daily close was near to the opening levels. Our silver technical analysis indicatoes, that while the bearish move below 22.36 was rejected, a candle like this still indicates a certain amount of indecisiveness in this market.
Oversold Stochastic Oscillator
The stochastic oscillator is close to the oversold level which ties together with the fact that the market is trading at the range low. The moving averages are in the middle of the trading range and roughly moving sideways. This is typical in range-bound markets.
The nearest key resistance level in the daily chart can be found at 23.30 while the nearest daily support level below 22.36 is at 21.74. As a rule, traders tend to look for reasons to use mean reversion strategies near the edges of trading ranges. Only after the market breaks out of the trading range do traders usually look for directional trades.
Silver Technical Analysis, 4h
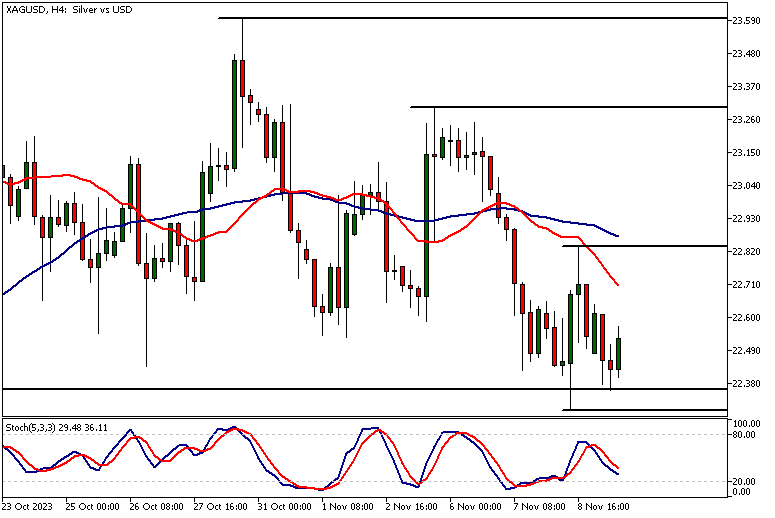
The 4-hour chart reveals an attempt to create a higher swing low at 22.36 after the market moved to 22.30 yesterday. If there is follow-through buying now, the market could be moving to yesterday's high at 22.84. A decisive break above this level is needed to open the way higher.
Should this be the case, silver technical analysis suggests we might see the market trading to the 23.30 resistance level. A failure to attract buyers would likely push the market down to yesterday's low again.
Client sentiment analysis
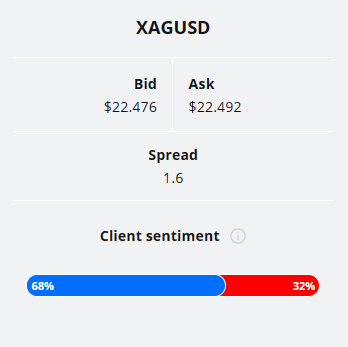
The TIOmarkets client sentiment graph shows 68% of traders are long and 32% are short the silver market.
Please remember that the retail trader client sentiment is a contrarian indicator as most of the retail traders are on average betting against the market trends. This is why, experienced traders tend to trade against the retail client sentiment. You can follow the TIOmarkets client sentiment live on our Forex dashboard.
The next key risk events impacting this market:
- USD - Fed Chair Powell's Speech
- USD - Prelim UoM Consumer Sentiment
- USD - Prelim UoM Inflation Expectations
- USD - CPI
Potential Silver Market Moves
The market is trading at the lower end of a weekly price range. If the bulls re-engage with the market now and start pushing it higher, we could see it trading to the weekly moving averages at 23.25 - 23.35.
Alternatively, if the support doesn't hold and there is a decisive break below the 22.36 support level, the market could trade down to 21.57.

How would you trade the Silver today?
I hope this fundamental and technical Silver analysis helps you to make better informed trading decisions. Check the latest market analysis for other instruments and subscribe to receive them in your inbox as soon as they are published
DISCLAIMER: TIO Markets offers an exclusively execution-only service. The views expressed are for information purposes only. None of the content provided constitutes any form of investment advice. The comments are made available purely for educational and marketing purposes and do NOT constitute advice or investment recommendation (and should not be considered as such) and do not in any way constitute an invitation to acquire any financial instrument or product. TIOmarkets and its affiliates and consultants are not liable for any damages that may be caused by individual comments or statements by TIOmarkets analysis and assumes no liability with respect to the completeness and correctness of the content presented. The investor is solely responsible for the risk of his/her investment decisions. The analyses and comments presented do not include any consideration of your personal investment objectives, financial circumstances, or needs. The content has not been prepared in accordance with any legal requirements for financial analysis and must, therefore, be viewed by the reader as marketing information. TIOmarkets prohibits duplication or publication without explicit approval.

Janne Muta holds an M.Sc in finance and has over 20 years experience in analysing and trading the financial markets.
Related Posts
Trade responsibly: CFDs are complex instruments and come with a high risk of losing all your invested capital due to leverage.

