USD/JPY Forecast for the Week of 6th April 2026
BY TIOmarkets
|April 6, 2026USD/JPY Market Overview
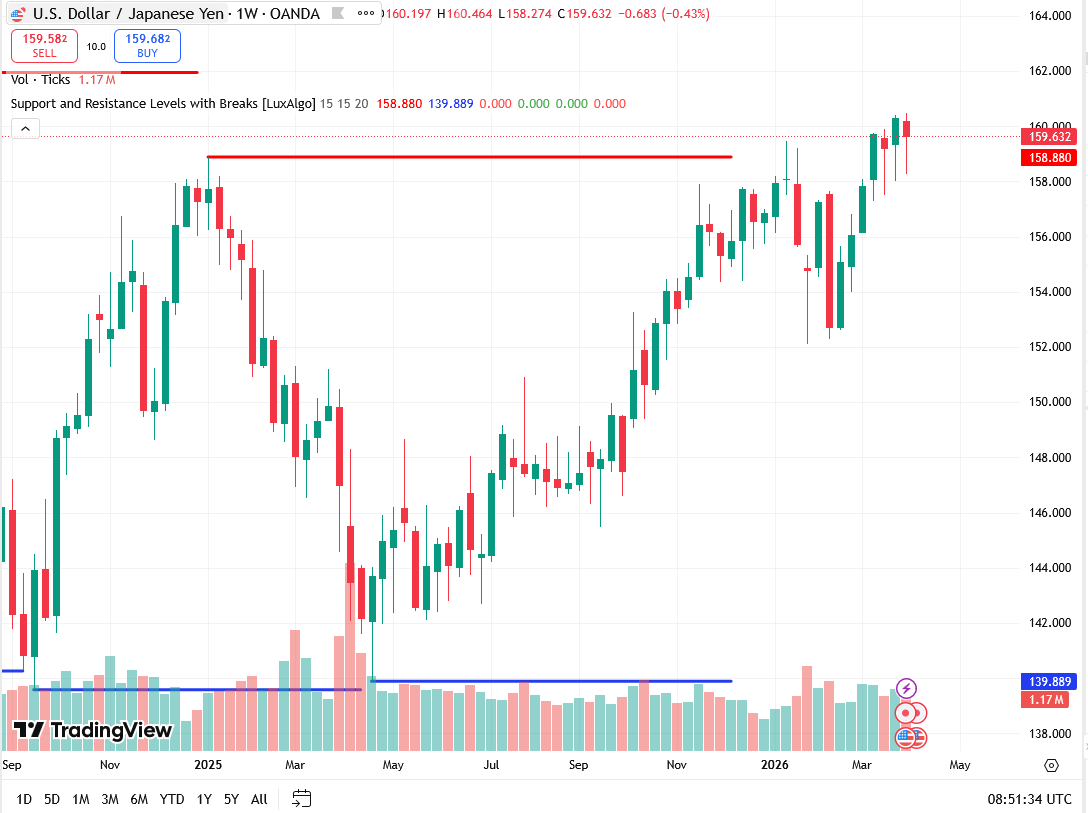
USD/JPY starts the week of 6–10 April 2026 near 159.60, pretty close to the major 160 psychological level, which clearly remains a big technical and macroeconomic turning point.
USD/JPY kept gaining after the big surge in March, and the main reasons are the interest rate differential between the United States and Japan and ongoing demand for carry trades.
With that said, the market is moving into a highly complicated stage. After USD/JPY made several attempts to jump above the 160 level, consolidation occurred, signaling that the upside momentum is slowing as markets reassess positioning after the recent US macro data.
The biggest picture remains unchanged. USD/JPY is still stuck in a long-term bullish trend and the last moves can be seen as a consolidation phase rather than a structural reversal.
Markets are still very volatile in the short term as the central bank-led story is fading and the data-driven environment is taking over where US data and Treasury yield movement
are really important.
Some key points that tip the scale right now are:
- A continuous rise in US Treasury yields which, in turn, fuel the demand for USD.
- Clear and consistent policy divergence between the Federal Reserve and Bank of Japan
- Very high sensitivityto intervention risk near the 160 level
- Constant carry trade positioning and leveraged flows
All that is leading currently to a bullish but fragile consolidation structure, with traders turning more cautious at these levels.
At the moment, USD/JPY is still hanging out within the upper bounds of a range with strong directional moves only coming from major economic news.
Technical Analysis for USD/JPY
Current Market Structure
Looking at the weekly timeframe, USD/JPY is showing a strong bullish macro trend, as it keeps making higher highs and higher lows.
The minor consolidation around 160 is a pause within the broader trend, not a reversal signal.
Looking at the days ahead, the pair seems to be exhibiting momentum fatigue, as it has failed to make a breakout from resistance.
The fact that the support levels have not been decisively broken means the trend is still valid overall.
Generally speaking, the pattern that has emerged at this time could be called a late-stage bullish trend transitioning into consolidation.
Moving Averages
In a very clear way, moving average patterns paint the picture of a bull market.
- Short-term MA (20-period): 156.50 (price level higher, supports the nearest levels)
- Mid-term MA (50-period): 153.50 (a major pivot point level)
- 100-period MA: 150.80
- 200-period MA: 144.50
The closing price is comfortably positioned above all major moving averages, signaling strong agreement of trend direction across different timescales.
An important support is located in the 155.00–153.50 zone, and this is the last line of defense for the present trend. Only if price falls below this level can the bullish assumption be challenged.
Momentum Indicators
At this point in time, momentum indicators point towards a neutral-to-bullish trend with early signs of saturation.
The current RSI is hovering above the 50-mark and so the players’ positions are basically bullish, but the indicator is showing signs of nearing the ceiling.
The MACD remains above zero level, indicating bullishness but the histogram shows a flattening momentum.
Simultaneously:
- The stochastic is about to enter the overbought zone.
- Williams %R indicates stretched conditions.
- ADX continues to maintain a level around 25, indicating the trend is strong but not gaining strength
These measurements imply:
- The trend is leaning bullish.
- Momentum is decelerating.
- The chance of short-term consolidation or corrective pullbacks is increasing.
Key Support and Resistance Levels
Here are the major levels considered significant this week
Resistance Levels
- 160.00: The defining psychological resistance level
- 160.50: Resistance right on the frontline
- 163.80: Main resistance level
- 166.20: Resistance level at the top
Support Levels
- 158.50: Support right on the frontline
- 155.50: Key structural support point
- 153.50: Secondary support
- 150.00: Medium-term support
If USD/JPY closes this week inside the 158.50 and 160.50 interval, the market is likely to stay in a range.
Bullish Scenario
USD/JPY may follow a positive path if it finds footing above 158.50 and picks up momentum for the upside.
A strong signal to resume the uptrend would be a steady break above 160.50.
If this comes to pass, the pair could potentially reach:
- 163.80
- 166.20
This case can be driven by the sustained upward pressure of US economic release, especially if indicators coming after the Nonfarm Payrolls also back it up.
The demand for USD would be underpinned by higher treasury yields, coupled with the carry trade receiving fresh support from BoJ/Fed policy divergence.
USD/JPY in such a case could be forecast to run quite far towards new highs of the bullish trend.
Bearish Scenario
A bearish possibility may happen if USD/JPY fails to protect the 158.50 level and slips below.
Such a downward move can cause correction toward:
- 155.50
- 153.50
This scenario will be a real possibility on deterioration of US data leading to falling yields and re-pricing of the Fed’s outlook
Besides, any sign of intervention from Japanese authorities or strong verbal warnings may cause strong downward price action.
Still, the longer-term upswing would remain intact unless the support level of 150.00 is broken.
USD/JPY Fundamental Drivers
Several macroeconomic factors are shaping the outlook for USD/JPY this week.
United States Economic Data
Besides the Nonfarm Payrolls, the macroeconomic calendar of the US will be the main focus. The markets are now looking for confirmation that economic performance is holding up.
Recent data indicates that business activities, the service sector in particular, remain steady, and as such, it is a major pillar of economic growth.
Labor market data is under heavier scrutiny as the markets weigh up whether employment is stable or starting to wane.
This week's data, especially ISM, retail, and labor follow-ups, will be crucial for a continued growth narrative of the US economy.
Indeed, stronger outcomes would lend support to USD/JPY through increased yields, while weaker data may prompt a pullback.
Federal Reserve Expectations
The market is in the process of reevaluating the time and size of the next cut.
The Federal Reserve is very much data-dependent, and policymakers have their eyes on both inflation and the labor market.
If the data continue to paint a picture of economic strength, then the Fed's rate cut expectation will be pushed back, and that would further strengthen the USD, keeping the USD/JPY uptrend intact.
On the other hand, if data disappoint, that will increase the chances of the Fed easing its monetary policy, thus resulting in lower yields and therefore pressure on the pair.
Bank of Japan Policy
The BoJ is still very accommodative with policy rates much lower than other major economies.
The very different policy stance remains the main reason for the upward momentum in USD/JPY.
Although any change in policy or signal of intervention will scare the market.
Near to current prices, especially around 160, the risk of verbal or directintervention shoots-up.
Policy Divergence
Since USD/JPY is influenced by the monetary policy divergence of the Fed and BoJ, we should continue to see the pair trend with the US dollar as long as the US economy sustains its relative strength and hence the Fed remains in a restrictive mode while Japan is still in the easement stage.
This divergence is still very much in favor of USD strength and thereby supporting the general uptrend.
This Week's USD/JPY High-Impact Events
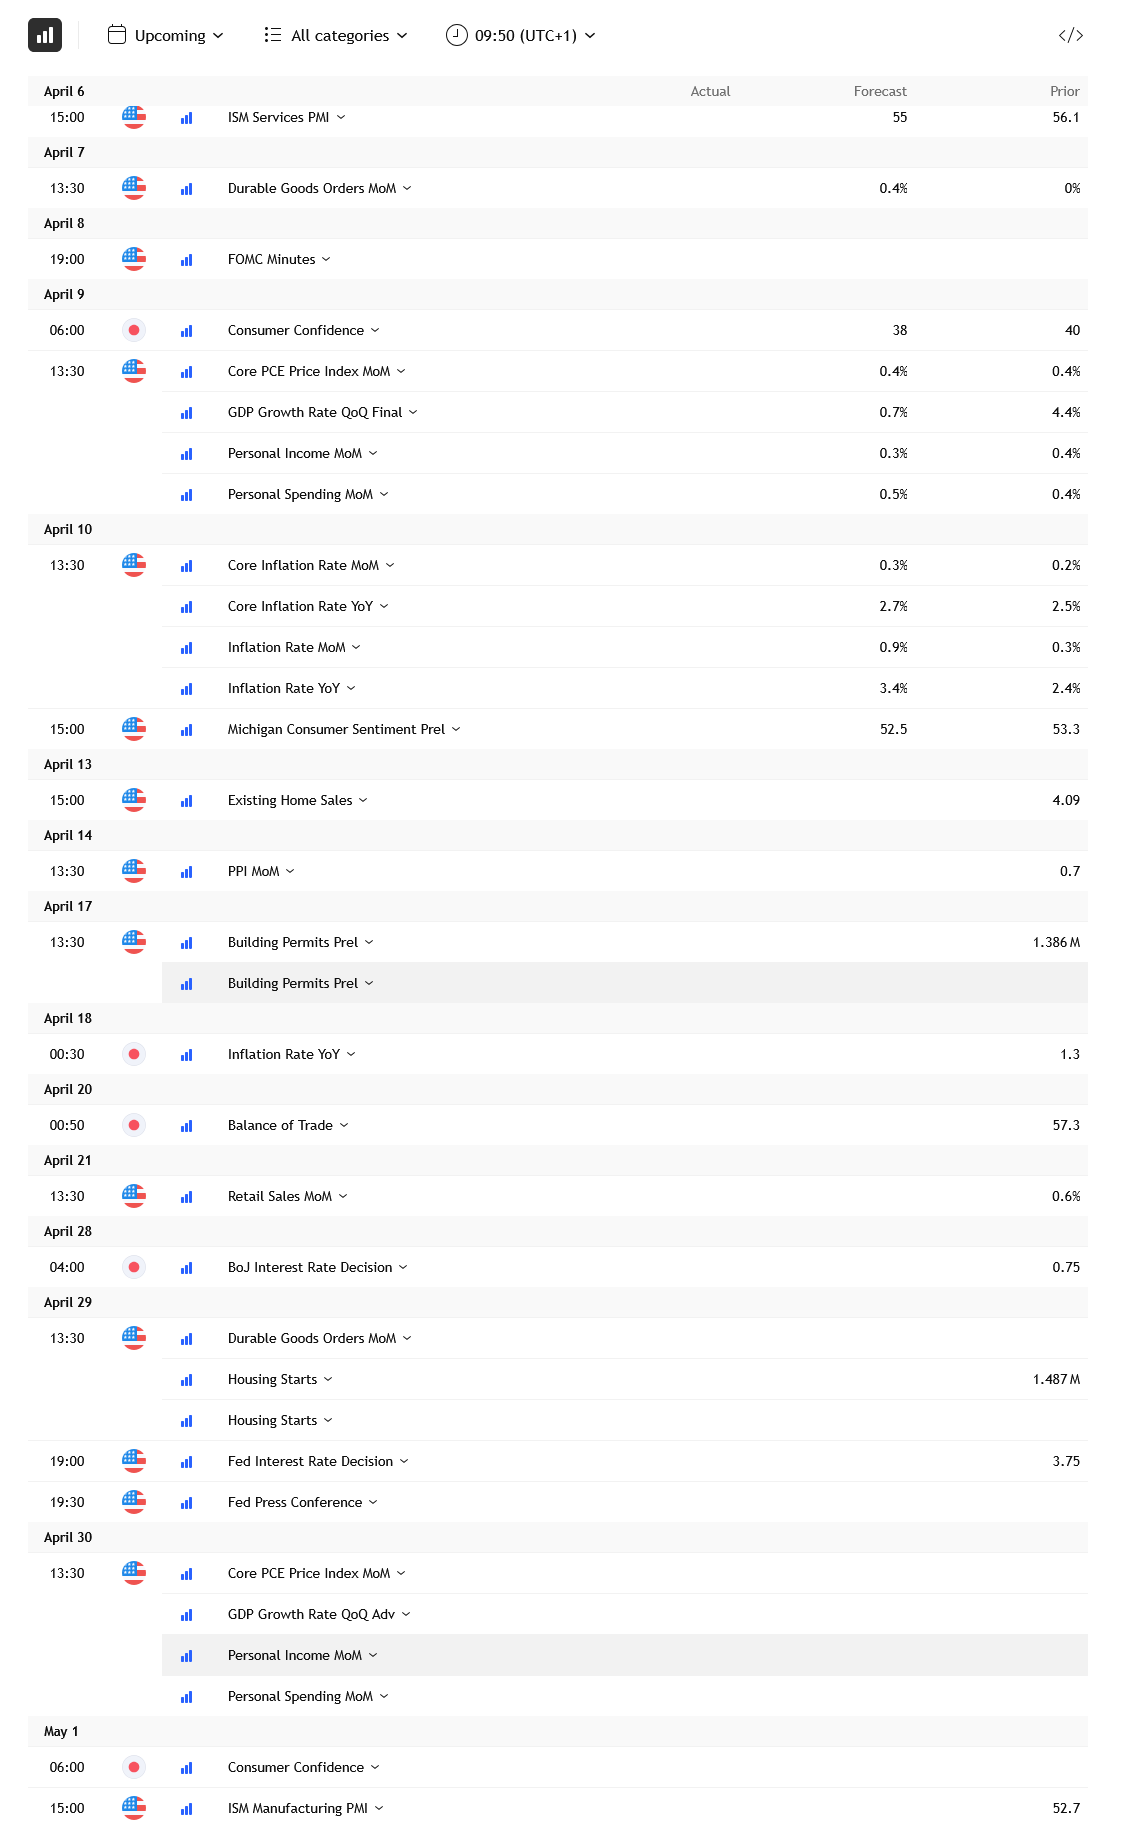
Several economic developments may influence USD/JPY volatility this week.
United States
- ISMManufacturingPMI: A measuring stick of economic momentum and activity in the manufacturing sector.
- ISMServicesPMI: Gives a solid indication of the health of the services sector, considering services make up the majority of US economy.
- Retail-Related Indicators: Help to visualize consumer demand and spending trends.
Japan
- Consumer-Related Indicators: Provide a thorough snapshot of domestic economic conditions.
Central Bank Communication
- Federal Reserve Speeches: Statements by Fed officials could cause changes in market interest rate expectations.
- Bank of Japan Speeches: Could have major implications for policy and intervention risk perceptions/refinements.
Risk Considerations for USD/JPY This Week
Certain factors may drive USD/JPY volatility.
Macroeconomic data surprises continue to be the main risk factor for the pair. Moving Treasury yields may have the most immediate impact on USD/JPY's price action. Intervention risk is still high at 160 level. Global risk sentiment will likely continue to be a factor that drives the yen currency.
Technical breakouts will be very closely watched by market participants for potential entries and exits.
Breaking out of the 158.50–160.50 range will set the market going in one direction or the other.

Risk disclaimer: CFDs are complex instruments and come with a high risk of losing money rapidly due to leverage. You should consider whether you understand how CFDs work and whether you can afford to take the high risk of losing your money. Never deposit more than you are prepared to lose. Professional client’s losses can exceed their deposit. Please see our risk warning policy and seek independent professional advice if you do not fully understand. This information is not directed or intended for distribution to or use by residents of certain countries/jurisdictions including, but not limited to, USA & Countries included in the OFAC sanction list. The Company holds the right to alter the aforementioned list of countries at its own discretion.
TIOmarkets offers an exclusively execution-only service. The views expressed are for information purposes only. None of the content provided constitutes any form of investment advice. The comments are made available purely for educational and marketing purposes and do NOT constitute advice or investment recommendation (and should not be considered as such) and do not in any way constitute an invitation to acquire any financial instrument or product. TIOmarkets and its affiliates and consultants are not liable for any damages that may be caused by individual comments or statements by TIOmarkets analysis and assumes no liability with respect to the completeness and correctness of the content presented. The investor is solely responsible for the risk of his/her investment decisions. The analyses and comments presented do not include any consideration of your personal investment objectives, financial circumstances, or needs. The content has not been prepared in accordance with any legal requirements for financial analysis and must, therefore, be viewed by the reader as marketing information. TIOmarkets prohibits duplication or publication without explicit approval.
Join us on social media
Authors BIO

Behind every blog post lies the combined experience of the people working at TIOmarkets. We are a team of dedicated industry professionals and financial markets enthusiasts committed to providing you with trading education and financial markets commentary. Our goal is to help empower you with the knowledge you need to trade in the markets effectively.


