Best Forex Tools to Enhance Your Trading Experience
BY Panagiotis Philippou
|March 27, 2026The best forex tools can be the difference between trading with clarity and trading in the dark. Whether you're analyzing price movements, calculating your position sizes, or managing your risk exposure, having access to the right tools helps you make more informed decisions when participating in the world's largest financial market.
What are forex trading tools?
Forex trading tools are software applications, calculators, trading platforms, and resources designed to help traders analyze market conditions, execute trades, manage risk, and improve their overall trading decisions. These tools range from charting platforms and technical indicators to economic calendars and automated trading systems that transform complex market data into information you can actually use.
This comprehensive guide will walk you through the essential categories of forex trading tools available to you today. We'll explain what each type of tool does, how it fits into your overall trading approach, and help you understand which tools align best with your particular trading style and current experience level.
Analysis tools
Some of the best forex tools help you study historical price movements and identify potential trading opportunities. This category includes price charts, technical indicators, and various forms of market data that reveal patterns and trends.
Execution tools
Allow you to open, modify, and close your trading positions efficiently. Your trading platform and the various order types it supports fall into this category, giving you control over how and when your trades are executed.
Risk management tools
Help you protect your trading capital by calculating appropriate position sizes, setting protective stop-loss levels, and monitoring your overall exposure across multiple positions.
Information tools
Keep you updated about upcoming economic events, breaking news, and changing market conditions that could impact currency prices and create trading opportunities or risks.
Learning and practice tools
Provide safe environments where you can develop your trading skills and test new strategies before committing real capital to the markets.
Here's what's important to understand: the best forex tools don't work in isolation. They function together as an integrated system that supports your entire trading operation. Understanding which tools you actually need and learning how to use them effectively is fundamental to developing a sustainable and disciplined trading approach. Not every tool will be relevant to your particular strategy, and using too many tools simultaneously can actually create confusion rather than clarity.
Let's explore the main categories of forex trading tools in detail.
Trading Platforms: Your Foundation for Market Access
Your trading platform serves as the foundation for your entire trading operation. This is also where a lot of the best forex tools live. This is the software where you'll view real-time price charts, conduct your technical analysis, execute your trades, and monitor all your open positions. Without access to a reliable, feature-rich trading platform, even the most carefully developed strategy becomes extremely difficult to implement effectively.
The two most widely adopted platforms in the retail forex trading community are MetaTrader 4 (MT4) and MetaTrader 5 (MT5). Both platforms were developed by MetaQuotes Software and have become industry standards because they successfully combine powerful analytical capabilities with interfaces that traders can actually navigate and understand.
Key Features to Look For in a Trading Platform
When evaluating trading platforms and the best forex tools, there are several essential features you should look for:
Comprehensive charting capabilities
Your platform should offer multiple timeframes (from one-minute charts to monthly charts), different chart types (candlestick, bar, and line charts), and the ability to display several charts simultaneously so you can monitor multiple currency pairs or timeframes at once.
Built-in technical indicators
Access to standard indicators for trend analysis, momentum measurement, and volatility assessment is essential. The platform should also support custom indicators if you want to expand beyond the built-in options.
Reliable order execution
Fast, dependable trade execution is critical. Your platform should support various order types including market orders (executed immediately at current prices), pending orders (executed when price reaches a specified level), and risk management orders like stop-loss and take-profit.
Customization and personalization
The ability to arrange your workspace according to your preferences, save chart templates for different trading setups, and create custom indicators or automated trading systems gives you flexibility as your skills develop.
Direct market access
Your platform should provide real-time access to all the currency pairs and other instruments you want to trade, with current pricing and immediate execution capabilities.
Clear account management interface
You need a clear, easy-to-read display of your account balance, how much margin you're currently using, all your open positions, and your complete trading history for record-keeping and performance analysis.
Mobile vs Desktop Trading: Understanding the Differences
Desktop trading platforms typically offer the most comprehensive feature sets available. Larger computer screens allow you to monitor multiple price charts and technical indicators simultaneously, making desktop platforms ideal for conducting detailed analysis and managing active trading sessions where you're executing multiple trades.
Mobile trading platforms prioritize convenience and accessibility over comprehensive features. While mobile apps may not include every advanced feature available on desktop versions, they allow you to monitor your open positions, receive important alerts, and execute trades from virtually anywhere. This flexibility becomes valuable when you need to manage existing positions while away from your computer or when you want to respond quickly to market-moving news events.
Your choice of trading platform directly impacts your day-to-day trading experience and your ability to implement your strategy effectively. It's worth investing time upfront to explore the platform options available through your broker and ensure the platform you select actually supports the specific tools and features your particular trading approach requires. You can of course always use the best forex tools for each platform.
Charting and Technical Analysis Tools
Chart analysis forms the foundation of most forex trading strategies used by retail traders today. Price charts display historical exchange rate movements over time, allowing you to identify recurring patterns, established trends, and potential reversal points that can inform your trading decisions.
The importance of chart analysis in forex trading cannot be overstated. While fundamental factors like economic data releases, employment reports, and central bank policy decisions drive the long-term direction of currency movements, technical analysis of price charts helps you identify the optimal entry and exit points for your individual trades. Charts reveal where other market participants are actively buying and selling, where significant support and resistance levels have formed, and whether price momentum is building in a particular direction or beginning to fade.
Types of Charts Available
Different chart types present price information in distinct ways, each with particular advantages:
- Line charts represent the simplest chart format, connecting closing prices across consecutive time periods with a continuous line. Line charts provide a clean, uncluttered view of the overall price direction without showing you the detailed price action that occurred within each individual period.
- Bar charts display four key price points for each time period: the opening price, the highest price reached, the lowest price reached, and the closing price. This information appears as vertical bars with small horizontal marks indicating the open and close. Bar charts show you the complete price range and directional movement for each time period.
- Candlestick charts present the same information as bar charts but use colored rectangular "bodies" that make price movements significantly easier to interpret at a glance. Green or white candlesticks typically indicate periods where price closed higher than it opened, while red or black candlesticks show periods where price closed lower. Candlestick charts have become the most popular chart type among forex traders because they make patterns and price action easier to recognize quickly.
Drawing Tools and Visual Analysis
Beyond selecting your chart type, drawing tools and visual markers enhance your analytical capabilities significantly. Drawing tools allow you to mark important price levels on your charts, identify trend channels, and measure potential price targets based on historical movements.
Common drawing tools available on most trading platforms include:
- Trend lines - Diagonal lines connecting a series of higher lows (in uptrends) or lower highs (in downtrends) to visualize the prevailing trend direction and potential support or resistance.
- Horizontal lines - Marking significant support levels (where price has previously found buying interest) and resistance levels (where price has previously encountered selling pressure).
- Fibonacci retracement levels - Mathematical ratios that help identify potential support and resistance levels based on the proportional retracement of previous price moves.
- Channels - Parallel lines that contain price movement within a defined range, helping you identify the boundaries of the current trend.
The best forex tools for charting are those that allow you to fully customize your workspace according to your preferences, save chart templates for your different trading setups, and quickly switch between various timeframes and currency pairs as you conduct your market analysis throughout the trading day.
Technical Indicators: Processing Price Data for Trading Signals
Technical indicators are some of the best forex tools. They are mathematical calculations applied to price data, volume information, or open interest that help traders identify trends, measure momentum, and spot potential reversal points in the market. While your price charts show you what has actually happened to exchange rates over time, technical indicators help you interpret what those historical price movements might suggest about potential future direction.
What technical indicators actually do is take historical price data and process it through specific mathematical formulas to generate trading signals or create visual representations of current market conditions. Some indicators appear directly on your price charts as lines or overlays (like moving averages that smooth price action), while others display in separate indicator windows below your main chart (like oscillators that measure momentum on a bounded scale).
Common Indicator Categories
Technical indicators generally fall into several main categories based on what aspect of market behavior they measure:
Trend Indicators
Trend indicators help you identify the current direction of price movement and assess the strength of that directional move. These tools are specifically designed to keep you trading in alignment with the dominant trend rather than fighting against it—a principle often described as "trading with the flow" of the market.
Momentum Indicators
Momentum indicators measure the speed and strength of price movements over a specified period. These tools help you assess whether an existing trend is gaining strength or losing momentum, and they can signal potential reversal points when momentum begins to diverge from price direction.
Volatility Indicators
Volatility indicators measure the degree of price fluctuation occurring over a given time period. High volatility means prices are moving dramatically with large swings, while low volatility indicates relatively stable, range-bound conditions with smaller price movements.
How to Use Technical Indicators Effectively
Technical Indicators are some of the best forex tools available. The key principle for effective indicator use is understanding that more indicators don't necessarily lead to better results. Many beginning traders make the mistake of loading their charts with numerous indicators simultaneously, creating a cluttered workspace that generates conflicting signals and leads to analysis paralysis rather than clear trading decisions.
Here's a practical approach to using technical indicators effectively:
- Start with just one or two indicators that complement each other.
- Understand what each indicator actually measures and what its signals mean. Don't add an indicator to your charts simply because it looks interesting or because someone recommended it.
- Recognize that different indicators perform better in different market conditions.
- Use indicators to confirm what you're already seeing in raw price action, not as standalone trading signals.
- Avoid the common temptation to keep adding more indicators until you find one that "works perfectly." No indicator works perfectly in all market conditions.
- Remember the fundamental limitation of all technical indicators: They are based entirely on historical price data. They can help you understand current market conditions and identify patterns that have historically preceded certain types of price movements, but they cannot predict future price direction with certainty.
The best forex tools for technical analysis are the ones you understand thoroughly and can apply consistently as part of a complete, well-defined trading strategy. Whether you use simple moving averages or complex custom indicators matters far less than whether you truly understand what their signals represent and can integrate that information into effective, disciplined decision-making.
Economic Calendars: Best Forex Tool for Market Events
While technical analysis focuses primarily on price charts and historical patterns, fundamental analysis examines the underlying economic factors that actually drive currency values over time. Economic calendars are essential tools that track scheduled releases of economic data, central bank policy announcements, and other significant events that can create substantial impacts on forex market prices.
Why fundamental analysis matters comes down to a straightforward principle: currencies represent entire economies. When economic data suggests that a particular economy is strengthening—showing job growth, rising GDP, or controlled inflation—its currency typically appreciates in value relative to other currencies. When economic data points to weakness—rising unemployment, contracting GDP, or problematic inflation—the currency often declines. Interest rate decisions made by central banks, employment reports, inflation measurements, and GDP figures all influence how traders and investors value one currency relative to another in the global marketplace.
The challenge with economic events is that while they're scheduled well in advance, their actual outcomes remain uncertain until the moment of release. An economic calendar tells you exactly when important data will be published, but it cannot tell you what the actual numbers will be or, perhaps more importantly, how the market will react to those numbers.
Using Economic Calendars for Trade Planning
Economic calendars support several practical approaches to managing your trading around scheduled events:
- Avoiding high-impact events entirely - Many traders, particularly those who are newer to forex or prefer lower-risk approaches, choose not to hold open positions during major economic releases. The volatility and rapid price movements that often accompany these events can trigger stop-loss orders unexpectedly or create unpredictable outcomes that don't align with technical analysis.
- Preparing for increased volatility - More experienced traders who want to maintain positions through economic releases might adjust their risk management to account for the expected volatility.
- Actively trading news releases - Some traders specifically target economic releases, attempting to profit from the volatility and rapid price movements they create. This approach requires extremely fast execution capabilities, robust risk management, and acceptance of the inherent unpredictability involved in how markets react to news.
Planning your trading schedule around the calendar - Even if you don't trade news events directly or adjust your positions specifically for releases, knowing when major events are scheduled helps you understand broader market behavior.
How to Read an Economic Calendar
Economic calendars typically display several key pieces of information for each scheduled event:
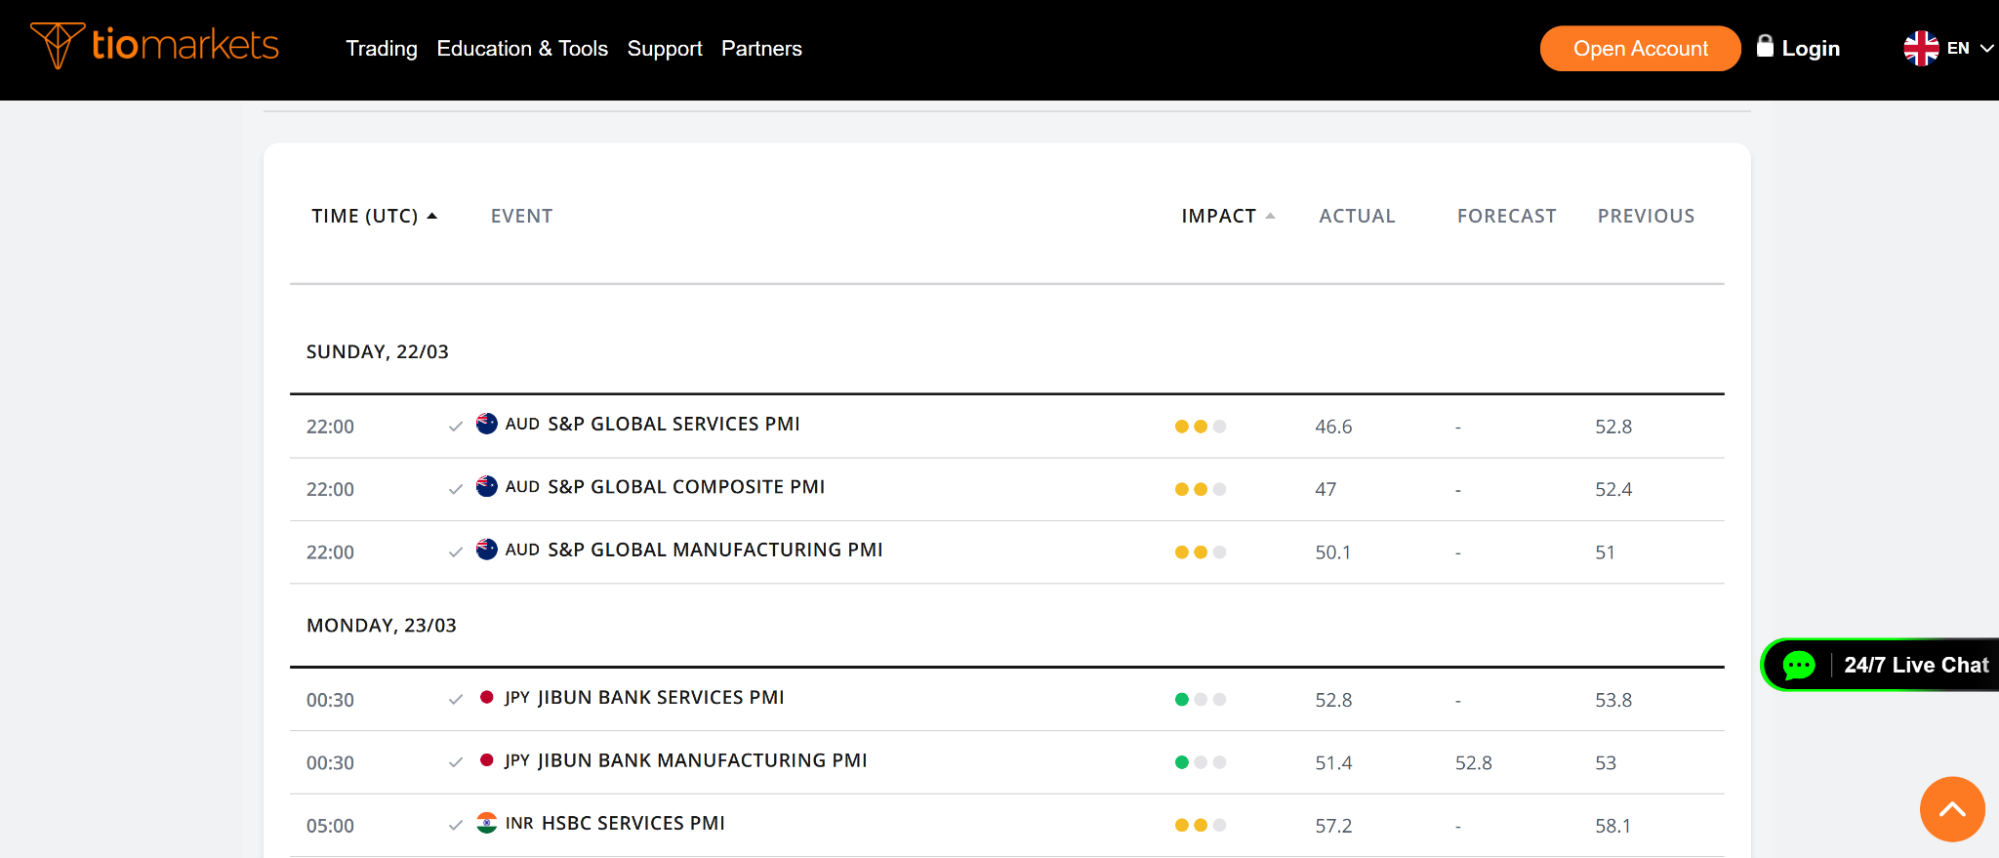
The best forex tools for fundamental analysis integrate economic calendars directly into your trading platform or provide mobile alerts and notifications, ensuring you're never caught off guard by a market-moving event you weren't aware of. Some advanced platforms even show you visually on your charts when major economic releases are scheduled, helping you plan your trading activity accordingly.
Understanding both technical factors (what the charts show) and fundamental factors (what economic conditions suggest) gives you a more complete picture of the forces moving currency prices. While you might rely primarily on technical analysis for timing your specific trade entries and exits, maintaining awareness of upcoming economic events helps you manage risk more effectively and avoid being blindsided by sudden volatility that doesn't fit your technical analysis.
Risk Management Tools: Protecting Your Trading Capital
Risk management tools represent arguably the most critical category in your entire trading toolkit. While analysis tools help you identify potential trading opportunities and execution platforms allow you to place trades, risk management tools protect your trading capital and help ensure you can continue participating in the markets even after experiencing the inevitable losses that all traders face. It comes to reason then that some of the best forex tools are those with the specific purpose of risk management
Stop-Loss and Take-Profit Orders
Stop-loss orders are instructions you give to your trading platform to automatically close a trade if price moves against your position to a specified level. This tool limits your maximum loss on any single trade to a predetermined, acceptable amount that you define before entering the trade.
These order types are essential tools because they remove emotion from your exit decisions. Without predetermined exit points established before you enter a trade, traders often fall into predictable psychological traps—holding losing positions too long while hoping they'll eventually recover, or exiting winning positions too early because of fear that profits will disappear. Stop-loss and take-profit orders enforce discipline by executing your planned exit strategy automatically according to the rules you established when you were thinking clearly, before emotions became involved.
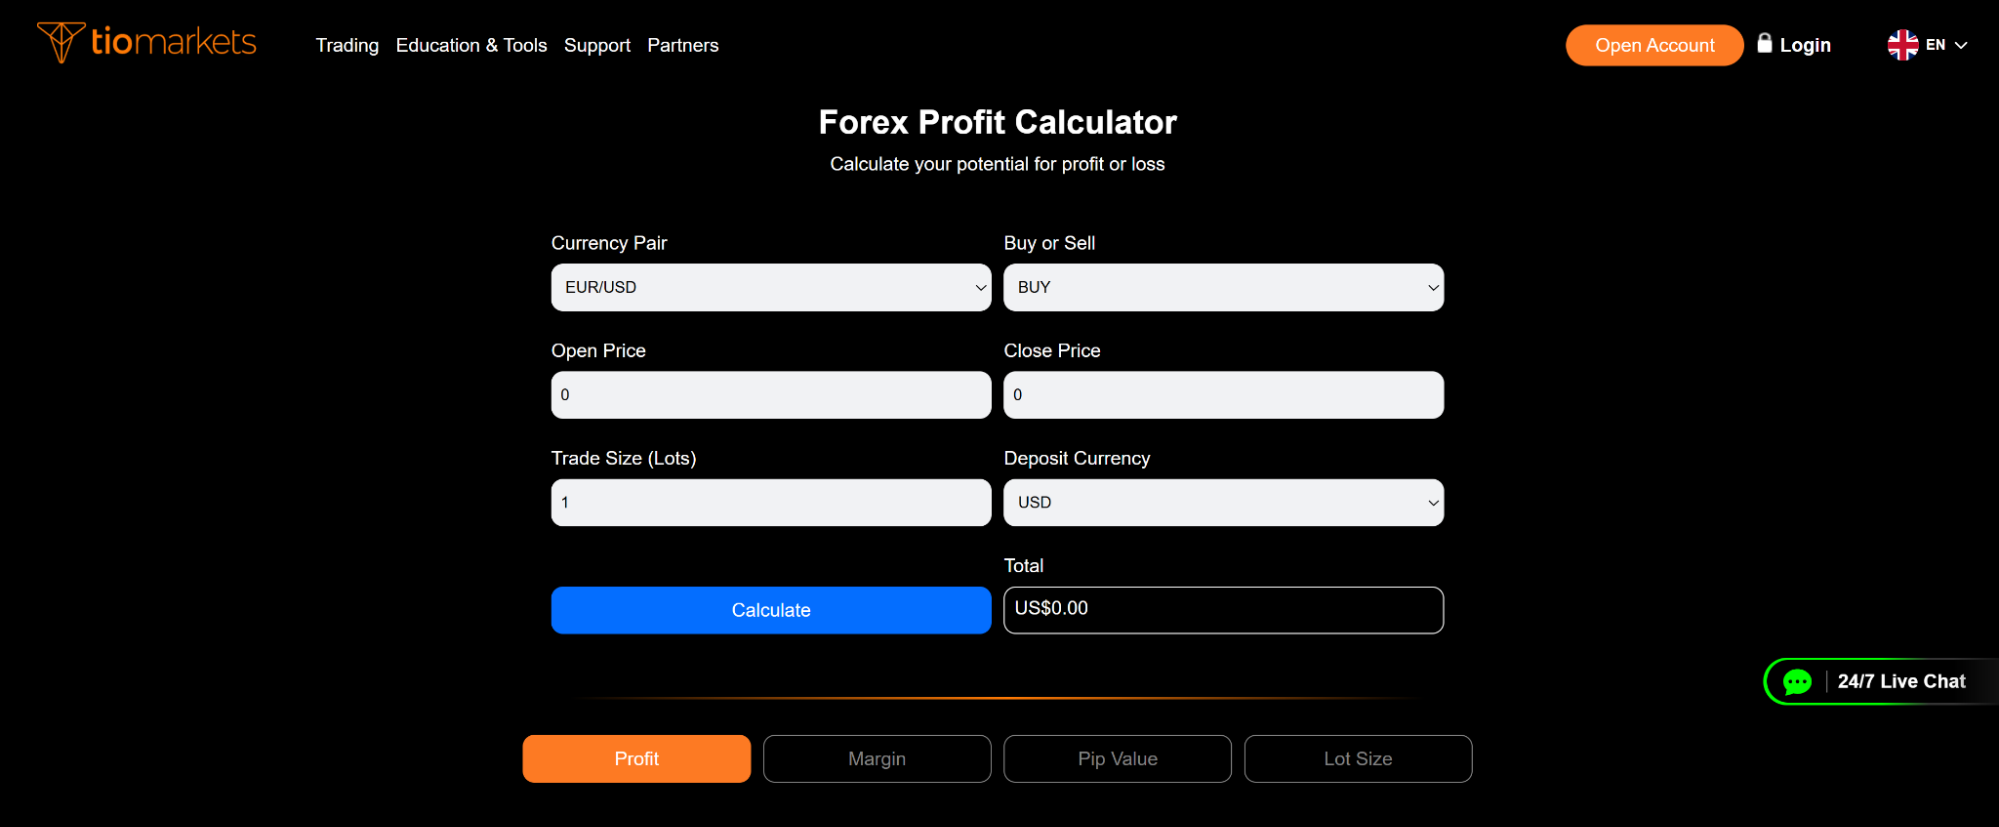
Position Sizing Calculators
Position sizing determines exactly how much of a currency pair you should trade based on your total account size, your personal risk tolerance, and the distance from your entry point to your stop-loss level. This calculation ensures you're risking an appropriate and consistent percentage of your total capital on each individual trade.
Position sizing calculators help you determine the correct lot size for each trade you take. The calculation takes into account several variables:
- Your total account balance - How much trading capital you have available
- The percentage of your account you're willing to risk - Most professional traders risk between 1-2% of their account on any single trade
- The distance in pips from your entry price to your stop-loss level - How much room you're giving the trade before it's closed
- The pip value for the specific currency pair you're trading - How much each pip of movement is worth in your account currency
Proper position sizing is one of the best forex tools available and is crucial because it ensures that no single trade, or even a series of losing trades, can significantly damage your trading account. This allows you to withstand the inevitable losing streaks that all traders experience without depleting your capital to the point where you can no longer trade effectively.
Risk-Reward Ratio Tools
Risk-reward ratio compares the potential profit you're targeting on a trade to the potential loss you're risking. A 2:1 risk-reward ratio means you're attempting to make twice as much profit as you're willing to lose. If you're risking 50 pips with your stop-loss placement, you would be targeting 100 pips of profit with your take-profit order.
Risk-reward ratio tools help you evaluate whether a potential trade setup offers sufficient profit potential to justify taking the risk involved. Many consistently successful traders maintain a rule that they only take trades offering at least a 2:1 or 3:1 risk-reward ratio. This approach means that even if they win less than half of their total trades, they can still achieve overall profitability because their winning trades are significantly larger than their losing trades.
How These Tools Work Together
These risk management tools function together as an integrated system that protects your capital throughout your trading:
- First, you identify a potential trade opportunity through your technical or fundamental analysis.
- Next, you use a position sizing calculator to determine exactly how much to trade based on your account size and risk tolerance.
- Then you set your stop-loss order to limit your potential loss to an acceptable, predetermined amount.
- Finally, you set your take-profit order based on a favorable risk-reward ratio that gives your trade the potential to be worthwhile.
The best forex tools for risk management are those built directly into your trading platform, making it straightforward and convenient to set protective stops and profit targets as you place each trade. Some advanced platforms also provide visual displays of your risk-reward ratio directly on your price charts, helping you evaluate the quality of potential trade setups before you commit capital.
Risk management isn't the exciting part of trading—analyzing charts and placing trades feels much more engaging. But risk management is what allows you to survive the inevitable difficult periods and continue trading long enough to benefit from the opportunities the forex market provides. The best forex tools are those specifically designed to help you manage risk.
Conclusion
The best forex tools function as an integrated system to transform complex market participation into a structured, disciplined operation. Ultimately, developing a sustainable approach means mastering the necessary tools, integrating them with discipline, and consistently prioritizing risk management on every trade. Once you are ready to put what you learned to use,

FAQ
Risk disclaimer: CFDs are complex instruments and come with a high risk of losing money rapidly due to leverage. You should consider whether you understand how CFDs work and whether you can afford to take the high risk of losing your money. Never deposit more than you are prepared to lose. Professional client’s losses can exceed their deposit. Please see our risk warning policy and seek independent professional advice if you do not fully understand. This information is not directed or intended for distribution to or use by residents of certain countries/jurisdictions including, but not limited to, USA & Countries included in the OFAC sanction list. The Company holds the right to alter the aforementioned list of countries at its own discretion.
TIOmarkets offers an exclusively execution-only service. The views expressed are for information purposes only. None of the content provided constitutes any form of investment advice. The comments are made available purely for educational and marketing purposes and do NOT constitute advice or investment recommendation (and should not be considered as such) and do not in any way constitute an invitation to acquire any financial instrument or product. TIOmarkets and its affiliates and consultants are not liable for any damages that may be caused by individual comments or statements by TIOmarkets analysis and assumes no liability with respect to the completeness and correctness of the content presented. The investor is solely responsible for the risk of his/her investment decisions. The analyses and comments presented do not include any consideration of your personal investment objectives, financial circumstances, or needs. The content has not been prepared in accordance with any legal requirements for financial analysis and must, therefore, be viewed by the reader as marketing information. TIOmarkets prohibits duplication or publication without explicit approval.
Join us on social media
Authors BIO

Panagiotis is an online trading specialist with extensive experience in forex, indices, and commodities. He enjoys sharing his experience to help traders better understand global financial markets.


