Dow Jones Technical Analysis | Dow trades near all-time highs ahead of CPI
BY Janne Muta
|Ocak 10, 2024Dow Jones Technical Analysis – The trading day yesterday on the NYSE saw declining stocks outnumbering advancers and a slight decrease in total trading volumes. This cautious sentiment reflects market anticipation ahead of the US CPI release.
Analyst expectations point towards a modest rise in monthly CPI (0.2%) and Core CPI (0.3%), with a year-on-year CPI forecast of 3.2%. These figures are crucial as they may influence the Federal Reserve's monetary policy decisions, particularly in interest rate adjustments to manage inflation. Investors might be adopting a wait-and-see approach, gauging how these inflation numbers will sway the Fed's stance on economic tightening or easing.
In November 2023, the core consumer price inflation, which excludes fluctuating elements like food and energy, remained unchanged at 4%, meeting market forecasts and reaching a two-year nadir. Month-on-month, core prices saw a minor rise of 0.3%, a marginal escalation from October's 0.2% increment.
Furthermore, the overall yearly inflation rate fell to 3.1%, marking a five-month low and slightly under the anticipated 3.2%. This dip was primarily driven by significant reductions in energy expenses, with marked declines in gasoline, utility gas, and fuel oil costs. On a monthly scale, consumer prices edged up by 0.1%, where increased shelter expenses balanced out the fall in gasoline prices, keeping core inflation stable at 4%.
Summary of This Dow Jones Technical Analysis Report:
- The Dow Jones saw a minor correction of 1.6% last week after a significant 17% rise from the October low. Trading near all-time highs, this dip isn't worrisome. The index outperforms others in the US and Europe, indicating strength. Key support lies at 36,954, the previous high in January 2022.
- Recently, the Dow Jones formed a higher reactionary low at 37,212, indicating bullish momentum. It's attracting buyers above this level and the 20-day moving average. The market is above both moving averages, and the stochastic oscillator signals a buy, hinting at continued upward movement. Next target: 37,812.
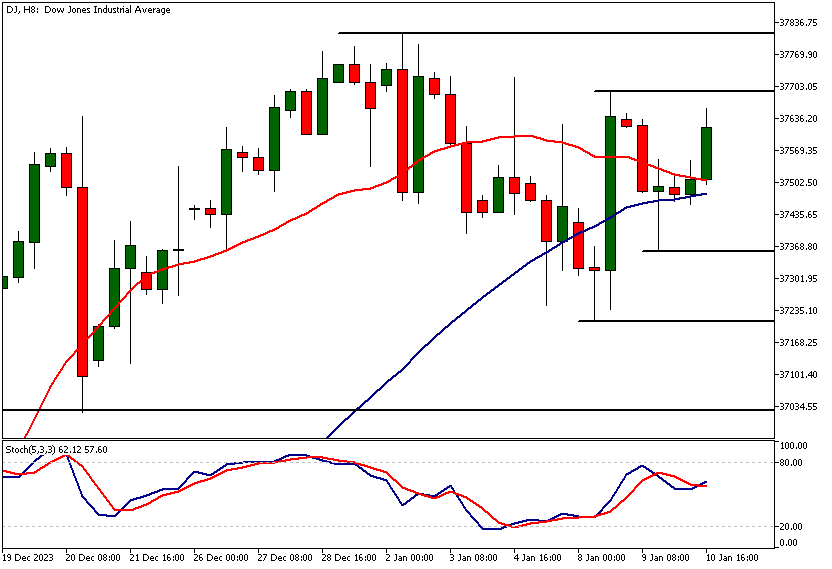
- On the 8-hour chart, the Dow Jones shows contracting moving averages, with the 20-period nearing the 50-period. A higher swing low at 37,360 suggests ongoing upward momentum. Key resistance levels are at 37,693 and 37,738. Despite some contraction, overall market analysis indicates sustained upward movement.
Read the full Dow Jones Technical Analysis report below.
Dow Jones Technical Analysis

Weekly Dow Jones Technical Analysis
Following a run of approximately 17% from the October low, the Dow Jones traded lower last week. This correction was relatively minor, only 1.6%. Currently trading near its all-time high levels, this slight slowdown in upside momentum is not a cause for concern. In fact, the index has been comparatively strong over the past two weeks, especially when contrasted with other actively traded indices in the US and Europe. Therefore, unless the entire equity market sells off, it appears more likely that the Dow Jones will remain strong.
The nearest key weekly support level is at 36,954. This was the previous all-time high reached in January 2022. With the critically important US CPI release due tomorrow, markets could be trading more cautiously today and tomorrow before the announcement.
Dow Jones technical analysis, based on moving averages, indicates that the market is still in a long-term uptrend with both moving averages pointing higher and the 20-period moving average above the 50-period SMA.
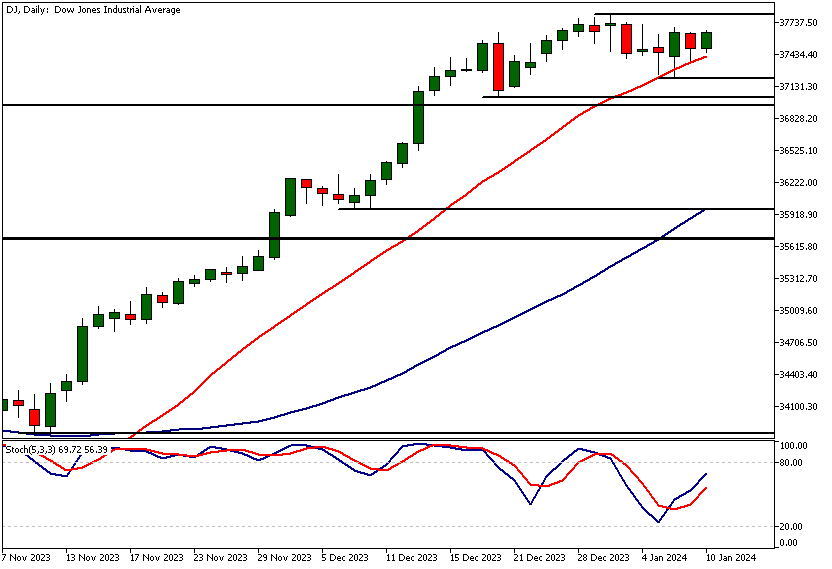
Daily Dow Jones Technical Analysis
The daily chart shows how the market has created a higher reactionary low (37,212) two days ago. Following this, the market attracted buyers at the 20-day moving average yesterday. Buying commenced well above the formation of a higher reactionary low, creating yet another bullish indication for this market.
Apart from price action-based Dow Jones technical analysis, the moving averages also support a bullish market view. Both moving averages are trending upwards, and the market is trading above them. The stochastic oscillator has given a buy signal and points higher, suggesting upward momentum in the market. Above 37,212, look for a move to the latest all-time high of 37,812. Alternatively, below 37,212, the market could trade down to around 36,960.
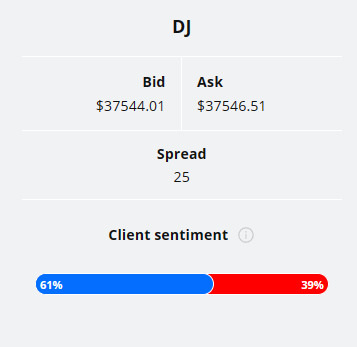
Client sentiment analysis
61% of clients trading Dow Jones are holding long positions, while 39% are holding short positions. Client sentiment data is being provided by TIO Markets Ltd.
It’s good to remember that retail client trading sentiment is a contrarian indicator as most retail traders are on average trading against market price trends. This is why experienced traders tend to trade against the retail client sentiment. You can follow the TIOmarkets client sentiment live on our Forex dashboard.
The next key risk events impacting this market
- USD - Core CPI m/m
- USD - CPI m/m
- USD - CPI y/y
- USD - Unemployment Claims
- USD - 30-y Bond Auction
- USD - Core PPI m/m
- USD - PPI m/m
Potential Dow Jones Market Moves
Dow Jones could extend its upward trajectory, targeting the recent high of 37,812, supported by strong technical indicators like moving averages and stochastic oscillators. Alternatively, a break below the key support level of 37,212 might see the index retreat towards around 36,960, especially if external market pressures intensify.

How Would You Trade the Dow Jones Today?
I hope this fundamental and technical Dow Jones analysis helps you to make better informed trading decisions. Check the latest market analysis for other instruments and subscribe to receive them in your inbox as soon as they are published
DISCLAIMER: TIO Markets offers an exclusively execution-only service. The views expressed are for information purposes only. None of the content provided constitutes any form of investment advice. The comments are made available purely for educational and marketing purposes and do NOT constitute advice or investment recommendation (and should not be considered as such) and do not in any way constitute an invitation to acquire any financial instrument or product. TIOmarkets and its affiliates and consultants are not liable for any damages that may be caused by individual comments or statements by TIOmarkets analysis and assumes no liability with respect to the completeness and correctness of the content presented. The investor is solely responsible for the risk of his/her investment decisions. The analyses and comments presented do not include any consideration of your personal investment objectives, financial circumstances, or needs. The content has not been prepared in accordance with any legal requirements for financial analysis and must, therefore, be viewed by the reader as marketing information. TIOmarkets prohibits duplication or publication without explicit approval.
Join us on social media

Janne Muta holds an M.Sc in finance and has over 20 years experience in analysing and trading the financial markets.
Related Posts


Trade responsibly: CFDs are complex instruments and come with a high risk of losing all your invested capital due to leverage.