EURCHF Analysis | Breakout from a triangle formation
BY Janne Muta
|Ocak 10, 2024EURCHF Analysis - The Swiss and Euro Area economies have had contrasting trends lately. Switzerland's inflation rate increased to 1.7%, surpassing predictions and previous figures, driven by higher costs in various sectors, including housing, energy, and food. Conversely, the Euro Area saw improved economic sentiment, reaching its highest since May, suggesting a more optimistic business and consumer outlook, despite rising inflation expectations.
Retail sectors in both regions displayed divergent trends. Switzerland's retail sales showed recovery with a 0.7% year-on-year increase in November, bolstered by non-food products, while the Euro Area experienced a 0.3% decline in retail sales, indicating a contraction in various segments, including online retail.
The unemployment scenario also varied. Switzerland experienced an increase in unemployment, reaching 2.3% in December, the highest since April 2022. In contrast, the Euro Area maintained a stable unemployment rate at 6.4%, with youth unemployment slightly decreasing. This stability in the Euro Area's job market contrasts with Switzerland's rising unemployment, particularly among the youth.
The European Central Bank's decision to hold interest rates steady and plan to end its bond purchase scheme by mid-2024 reflects a strategic approach to address high inflation. This contrasts with Switzerland's situation, where consumer prices remained stable month-on-month, but the core inflation rate edged up.
Overall, the Euro Area shows signs of resilience with improving economic sentiment and stable unemployment, despite retail challenges. Switzerland, facing rising inflation and unemployment, shows a mixed economic picture with retail sector recovery but increasing costs in essential sectors.
Summary of This EURCHF Analysis Report:
- EURCHF has been in a downtrend, recently re-entering its descending trend channel after a brief drop below. Despite a rally, key resistance at 0.9403 and Fibonacci level at 0.9448 remain untested. Indicators, including moving averages and stochastic oscillator, confirm a long-term bearish trend.
- EURCHF is attempting a breakout from a triangle pattern, aiming for the 20-period moving average at 0.9385, just below the higher resistance at 0.9403. However, with underlying bearish momentum and key resistance levels close, there's a high chance this counter-trend rally might fail, possibly retracing back to 0.9254.
- On the 4-hour chart, EURCHF shows a breakout from consolidation. A potential crossover of the 20-period moving average above the 50-period SMA indicates a possible trend reversal.
Read the full EURCHF analysis report below.
EURCHF Analysis
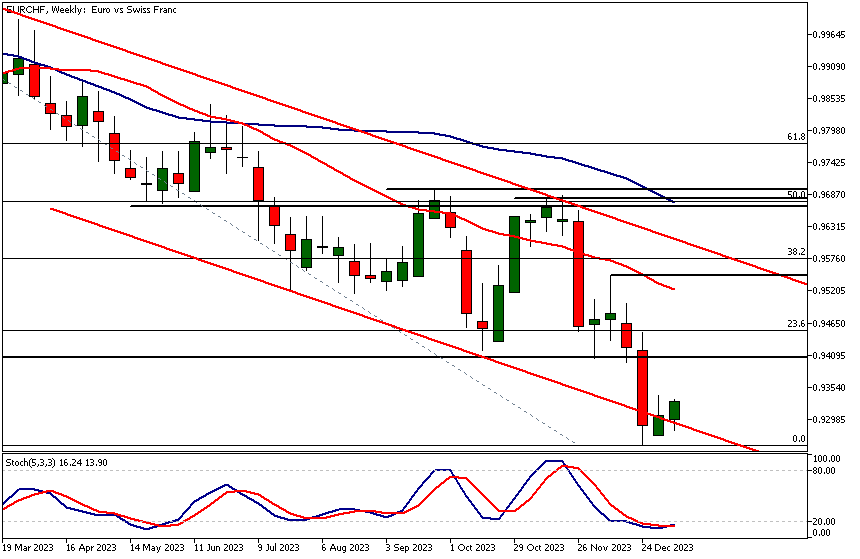
Weekly EURCHF analysis
The EURCHF has been trading lower for several months and is now trading relatively close to the descending trend channel's low. After extending the downside move outside the channel, the market has crossed back inside and is currently rallying against the bearish trend.
The nearest key resistance level is at 0.9403, with the 23.6% Fibonacci retracement level at 0.9448. Indicator-based EURCHF analysis aligns with the price action-based analysis, suggesting that the market remains in a long-term downtrend. The 20-period moving average is below the 50-period moving average, and both are pointing lower. Simultaneously, the stochastic oscillator is in the oversold area, below 20.
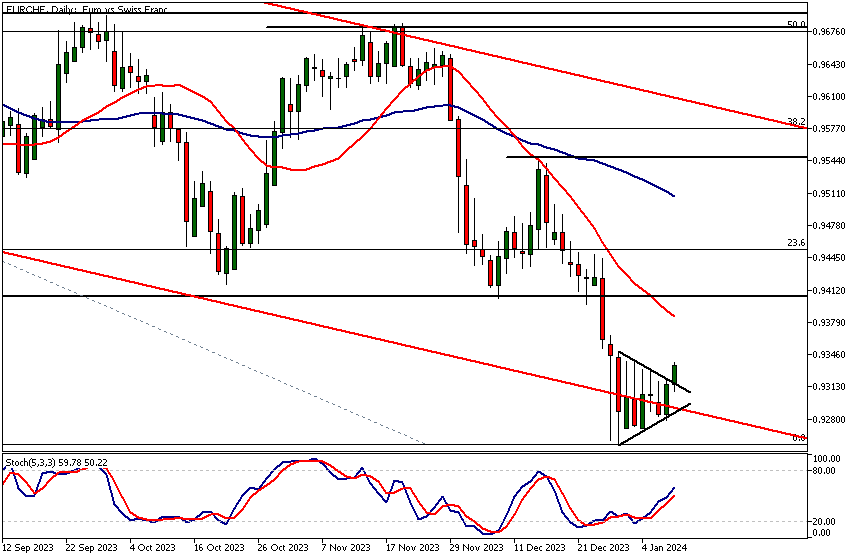
Daily EURCHF analysis
The market is breaking out of a triangle formation. If this breakout is decisive and there's follow-through buying, we could see the market trading to the 20-period moving average, (currently at 0.9385). The SMA(20) is located below a higher time frame resistance level at 0.9403.
The stochastic oscillator points higher, reflecting the change in momentum. Moving averages based EURCHF analysis suggests the market is still bearish, increasing the probability of this counter-trend rally failing at some stage, possibly at the 0.9403 resistance. If the market fails to reach the 0.9385 - 0.9403 range, it's likely that the recent low at 0.9254 gets retested.

Intraday EURCHF Analysis
The 4-hour EURCHF chart paints a similar picture, with the market breaking out of the consolidation formation. In this timeframe, the 20-period moving average is about to cross above the 50-period SMA, providing a lagging indication of potential trend reversal. In other words, the moving average-based EURCHF analysis supports the view gained from price action-based analysis.
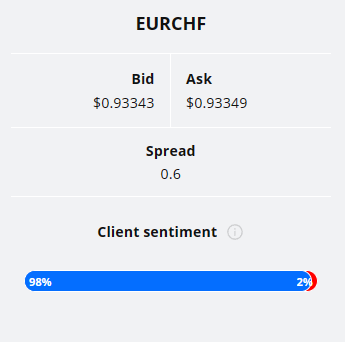
Client sentiment analysis
98% of clients trading EURCHF are holding long positions, while 2% are holding short positions. Client sentiment data is being provided by TIO Markets Ltd.
It’s good to remember that retail client trading sentiment is a contrarian indicator as most retail traders are on average trading against market price trends. This is why experienced traders tend to trade against the retail client sentiment.You can follow the TIOmarkets client sentiment live on our Forex dashboard.
The next key risk events impacting this market
- EUR - French Flash Manufacturing PMI
- EUR - French Flash Services PMI
- EUR - German Flash Manufacturing PMI
- EUR - German Flash Services PMI
- EUR - Flash Manufacturing PMI
- EUR - Flash Services PMI
- EUR - German ifo Business Climate
- EUR - Main Refinancing Rate
- EUR - Monetary Policy Statement
- EUR - ECB Press Conference
Potential EURCHF Market Moves
The market could extend its rally, breaking past the key resistance levels at 0.9403 and potentially reaching the 0.9448 Fibonacci retracement. Alternatively, failure to sustain the rally might lead to retesting the recent low at 0.9254, maintaining the downtrend.

How Would You Trade EURCHF Today?
I hope this fundamental and EURCHF analysis helps you to make better informed trading decisions. Check the latest market analysis for other instruments and subscribe to receive them in your inbox as soon as they are published
DISCLAIMER: TIO Markets offers an exclusively execution-only service. The views expressed are for information purposes only. None of the content provided constitutes any form of investment advice. The comments are made available purely for educational and marketing purposes and do NOT constitute advice or investment recommendation (and should not be considered as such) and do not in any way constitute an invitation to acquire any financial instrument or product. TIOmarkets and its affiliates and consultants are not liable for any damages that may be caused by individual comments or statements by TIOmarkets analysis and assumes no liability with respect to the completeness and correctness of the content presented. The investor is solely responsible for the risk of his/her investment decisions. The analyses and comments presented do not include any consideration of your personal investment objectives, financial circumstances, or needs. The content has not been prepared in accordance with any legal requirements for financial analysis and must, therefore, be viewed by the reader as marketing information. TIOmarkets prohibits duplication or publication without explicit approval.
Join us on social media

Janne Muta holds an M.Sc in finance and has over 20 years experience in analysing and trading the financial markets.
Related Posts


Trade responsibly: CFDs are complex instruments and come with a high risk of losing all your invested capital due to leverage.