Gold Technical Analysis | Has gold discounted the impact of US CPI report?
BY Janne Muta
|Ocak 8, 2024Gold Technical Analysis - Gold Technical Analysis – Gold is trading near to a technical confluence level ahead of the US inflation numbers due on Wednesday. Analyst consensus sees the annualised inflation increasing slightly from 3.1% to 3.2%.
Higher inflation could increase speculation on the Fed holding rates higher for longer thus supporting the dollar and pressuring gold. The question is has the gold market already discounted the expected uptick in inflation? Here’s a quick recap on recent inflation trends in the US.
In November 2023 the core consumer price inflation, which excludes volatile items like food and energy, maintained its rate at 4%, aligning with market forecasts and marking a two-year low. On a monthly basis, core prices rose by 0.3%, a slight increase from October's 0.2%.
The broader annual inflation rate also recorded a decrease, reaching 3.1%, the lowest in five months and just below the analyst's expectation of 3.2%. This reduction was influenced by significant drops in energy costs, with gasoline, utility gas, and fuel oil prices all declining sharply.
Month-over-month, consumer prices edged up by 0.1%, with higher shelter costs offsetting a decline in gasoline prices, while core inflation remained consistent at 4%.
Summary of This Gold Technical Analysis Report:
- Gold's recent high at 2088.44 indicates potential softening of bids in the coming weeks, marking it as a key resistance level. The nearest support level at 1,973, aligned with the 20-period moving average, could become a target if gold declines to this point, potentially stimulating market demand.
- Gold has reached a confluence with the 50-period moving average and a rising trend line near the 2015.58 support level. The upward trend of both 20 and 50-period moving averages suggests a continuing medium-term uptrend. The market being oversold in the daily timeframe aligns with this bullish sentiment.
- The 2-hour chart shows resistance at 2,046.57, near the 50-period moving average. Traders might target this level if buyers are attracted to the confluence area of the moving average, rising trend line, and the 2015.58 market structure level. However, the risk of continued downward momentum remains.
Read the full gold technical analysis report below.
Gold Technical Analysis
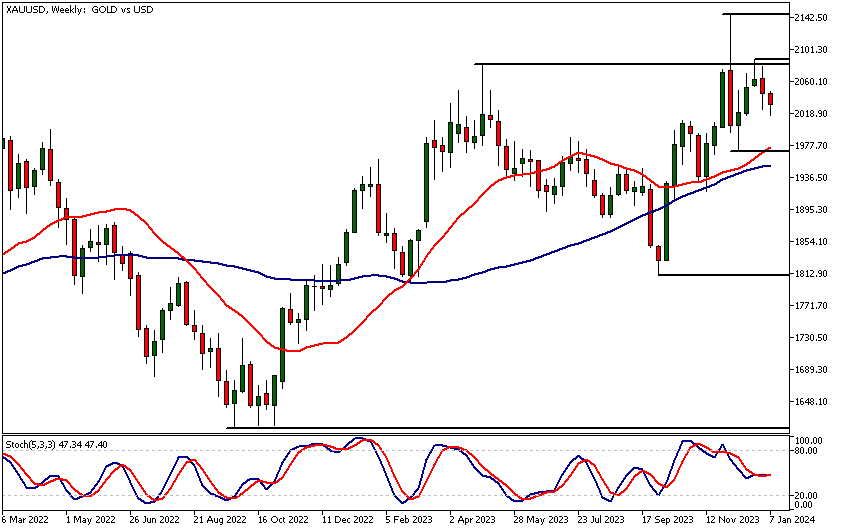
Weekly Gold Technical Analysis
The lower reactionary high at 2088.44 suggests that bids in gold might soften in the coming weeks. This high represents the nearest key resistance level. The closest weekly support level at 1,973 aligns closely with the 20-period moving average.
When two technical factors converge at a certain level, it often attracts more traders' attention, thereby enhancing the level's technical significance. If gold trades down to 1973, our gold technical analysis indicates that this level could serve as a target, potentially stimulating demand around it.
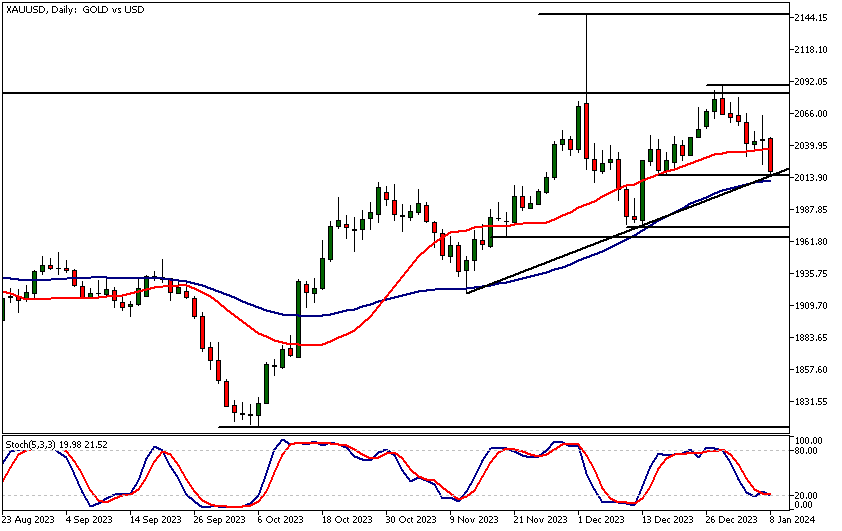
Daily Gold Technical Analysis
Gold has reached a technical confluence area with the 50-period moving average and a rising trend line, potentially supporting the market near a horizontal support level at 2015.58.
Both the 20 and 50-period moving averages are trending upwards, indicating that the gold market is still in a medium-term uptrend. According to oscillator-based gold technical analysis, the market is currently oversold, which aligns with the price action-based analysis.
If the gold market attracts buyers above the 50-period moving average (currently at 2011), we might see the market trading at 2046.57, and then possibly extending to 2064. Conversely, below 2011, our gold technical analysis suggests the market could trade down to 1998.

Intraday Gold Technical Analysis
The 2-hour chart identifies the nearest minor resistance level at 2,046.57, which is somewhat aligned with the 50-period moving average. If the market soon attracts buyers in the confluence area created by the 50-period moving average and the rising trend line, along with the market structure level at 2015.58, short-term traders might target the 2046.57 level.
Indicator-based gold technical analysis shows that both the 20 and 50-period moving averages are pointing lower in the 2-hour timeframe, as the market has been trending downwards, suggesting the risk of continued downside momentum. Therefore, traders should consider buying the market only if price action above the 50-period moving average (as highlighted in the daily gold technical analysis section) indicates institutional buying.
The next key risk events impacting this market:
- USD - 10-y Bond Auction
- USD - Core CPI m/m
- USD - CPI m/m
- USD - CPI y/y
- USD - Unemployment Claims
- USD - 30-y Bond Auction
- USD - Core PPI m/m
- USD - PPI m/m
Potential Gold Market Moves
Bullishly, if gold sustains above the 50-period moving average, it could rise towards 2046.57 and possibly extend to 2064. Bearishly, falling below this average might see gold declining to 1998. These scenarios depend on market reactions around key moving averages, reflecting different momentum directions.

How Would You Trade Gold Today?
I hope this Gold technical analysis helps you to make better informed trading decisions. Check the latest market analysis for other instruments and subscribe to receive them in your inbox as soon as they are published
DISCLAIMER: TIO Markets offers an exclusively execution-only service. The views expressed are for information purposes only. None of the content provided constitutes any form of investment advice. The comments are made available purely for educational and marketing purposes and do NOT constitute advice or investment recommendation (and should not be considered as such) and do not in any way constitute an invitation to acquire any financial instrument or product. TIOmarkets and its affiliates and consultants are not liable for any damages that may be caused by individual comments or statements by TIOmarkets analysis and assumes no liability with respect to the completeness and correctness of the content presented. The investor is solely responsible for the risk of his/her investment decisions. The analyses and comments presented do not include any consideration of your personal investment objectives, financial circumstances, or needs. The content has not been prepared in accordance with any legal requirements for financial analysis and must, therefore, be viewed by the reader as marketing information. TIOmarkets prohibits duplication or publication without explicit approval.
Join us on social media

Janne Muta holds an M.Sc in finance and has over 20 years experience in analysing and trading the financial markets.
Related Posts


Trade responsibly: CFDs are complex instruments and come with a high risk of losing all your invested capital due to leverage.