Nasdaq 100 Technical Analysis | Technology investors wait for the CPI
BY Janne Muta
|Ocak 11, 2024Nasdaq 100 Technical Analysis - Meta Platforms, Microsoft, and Boeing were among the top performers yesterday as Nasdaq continued to rally. The market has now gained 3.6% this week and is edging closer to the record high at 16,971. Seven out of 11 S&P 500 sectors gained yesterday with Tele Communication Services (+0.93%) and technology (+0.85%) sectors leading the rally while the energy sector was the worst performer losing 0.98%.
The bond market and yields continued fluctuating in a tight range as market operators wait for the CPI numbers. CPI could help them to understand if the Fed Funds futures traders' expectation of six 25 bp rate cuts in 2024 is justified. Futures traders are betting that the probability of the first rate cut in March is 67.1%.
Market analysts anticipate a slight increase in both monthly and core consumer price indices (CPI) – 0.2% and 0.3%, respectively – while the year-on-year CPI is projected to reach 3.2%. These figures hold significant weight as they could influence the Federal Reserve's monetary policy decisions, particularly interest rate adjustments to control inflation.
Summary of This Nasdaq 100 Technical Analysis Report:
- The Nasdaq reached new highs but showed a bearish shooting star candle above the previous all-time high of 16,767. Falling below 16,751 confirms bearish signals, targeting 16,170. If bulls take over, the index might rise to 16,890 and beyond. Long-term trends remain bullish, with moving averages and Stochastic Oscillator indicators.
- Breaking below the bull channel and a bearish wedge, Nasdaq targets 15,930, near a major weekly market structure level from last July. Currently at the SMA(20), a potential bounce back could lead to a return move to the channel low.
- Nasdaq trades below resistance at 16,547 and the SMA(50), signalling a bearish turn as it's below the slow and fast moving averages. Key support and resistance levels are at 16,165, 16,547, and 16,751, with the market's direction hinging on these crucial points.
Read the full Nasdaq 100 technical analysis report below.
Nasdaq 100 Technical Analysis
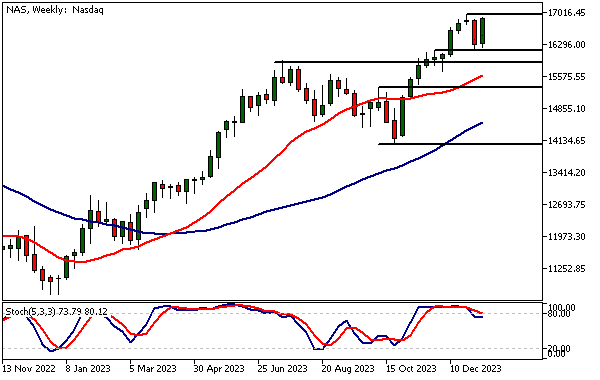
Weekly Nasdaq 100 Technical Analysis
Upside momentum was resumed in Nasdaq this week as the market has rallied strongly after a one-week retracement. The market is nearing the ATH levels and remains in a long-term uptrend as indicated by moving averages based on the Nasdaq 100 technical analysis.
Today's price action, following the CPI release is pivotal. The market needs to be able to push above the latest record high and maintain the levels above it for the uptrend to continue. Should the CPI come in much higher than expected and turn Nasdaq short-term bearish the nearest weekly support level at 16,176 could be tested. This obviously isn't a prediction, instead, it's part of our scenario analysis.
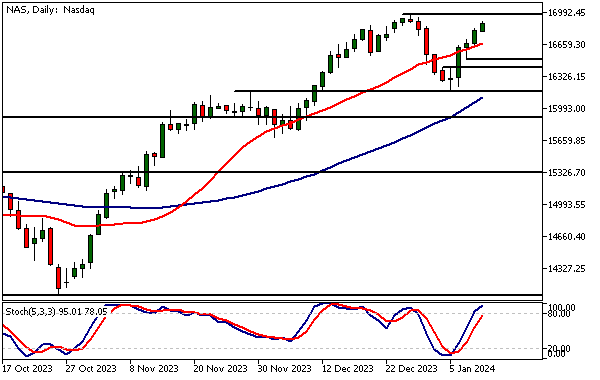
Daily Nasdaq 100 Technical Analysis
Nasdaq has rallied 3.4% in four days and could soon test the 16,971 resistance, the record high in Nasdaq. Whether the ATH level can be reached (or perhaps even breached) depends on market reactions after the CPI release but based on the recent daily momentum this might well happen.
At least, if the CPI comes in lower than expected. Analyst consensus expects the headline CPI to tick higher by 0.1% to 3.2% annually. Alternatively, if the inflation numbers are confirmed at higher levels than expected the rate-sensitive Nasdaq might correct down to 16,650 and then perhaps to 16,510 on extension.

Intraday Nasdaq 100 Technical Analysis
Nasdaq is trading above a market structure level (16,862) that has been important lately. It has acted as a support and resistance level varying its role depending on the direction the market approaches it from. Therefore, we should keep an eye on the level today. It could once again act either as a support or a resistance, depending on the CPI number and the subsequent market reaction.
Our Nasdaq 100 technical analysis is based on two highly important elements: momentum analysis and key price levels. Both are valuable in recognising the likely market direction and potential trade entry or exit levels. Momentum has been strong lately but the market is also trading relatively close to record highs.
And, the CPI release together with the ensuing price action are both unknown factors. Therefore, it is advisable to trade carefully by using only the best setups and keep the targets close if you are trading before the event.
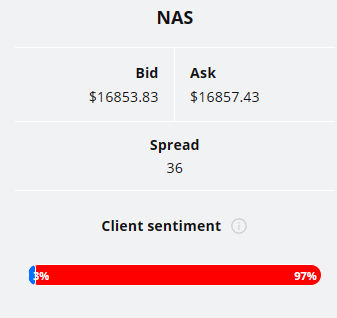
Client sentiment analysis
3% of clients trading Nasdaq are holding long positions, while 97% are holding short positions. Client sentiment data is being provided by TIO Markets Ltd.
It’s good to remember that retail client trading sentiment is a contrarian indicator as most retail traders are on average trading against market price trends. This is why experienced traders tend to trade against the retail client sentiment. You can follow the TIOmarkets client sentiment live on our Forex dashboard.
The next key risk events for this market
- USD - Core CPI m/m
- USD - CPI m/m
- USD - CPI y/y
- USD - Unemployment Claims
- USD - 30-y Bond Auction
- USD - Core PPI m/m
- USD - PPI m/m
Potential Nasdaq 100 Market Moves
The Nasdaq is currently in a bullish uptrend, with momentum indicators suggesting further upside potential. If the CPI comes in lower than expected, the market could test the record high of 16,971.
Alternatively, the release of the CPI data today could be a catalyst for a bearish reversal if inflation comes in higher than expected. In this case, the index could fall to 16,176, the nearest weekly support level. Investors should remain cautious and trade only the best setups with close targets in the run-up to the CPI release.

How Would You Trade The Nasdaq 100 Today?
I hope this Nasdaq 100 technical analysis helps you to make better informed trading decisions. Check the latest market analysis for other instruments and subscribe to receive them in your inbox as soon as they are published
DISCLAIMER: TIO Markets offers an exclusively execution-only service. The views expressed are for information purposes only. None of the content provided constitutes any form of investment advice. The comments are made available purely for educational and marketing purposes and do NOT constitute advice or investment recommendation (and should not be considered as such) and do not in any way constitute an invitation to acquire any financial instrument or product. TIOmarkets and its affiliates and consultants are not liable for any damages that may be caused by individual comments or statements by TIOmarkets analysis and assumes no liability with respect to the completeness and correctness of the content presented. The investor is solely responsible for the risk of his/her investment decisions. The analyses and comments presented do not include any consideration of your personal investment objectives, financial circumstances, or needs. The content has not been prepared in accordance with any legal requirements for financial analysis and must, therefore, be viewed by the reader as marketing information. TIOmarkets prohibits duplication or publication without explicit approval.
Join us on social media

Janne Muta holds an M.Sc in finance and has over 20 years experience in analysing and trading the financial markets.
Related Posts


Trade responsibly: CFDs are complex instruments and come with a high risk of losing all your invested capital due to leverage.