S&P 500 Technical Analysis | Tech stock optimism boosts the stock market
BY Janne Muta
|Ocak 9, 2024S&P 500 Technical Analysis - US equity indices rallied strongly yesterday, bringing relief to investors after a dip the previous week. The S&P 500 gained 1.4%, while the tech-heavy Nasdaq surged by 2.2%. The Dow Jones Industrial Average was weighed down by Boeing (-8%) but still managed to rise by 0.6%.
Ten out of eleven S&P 500 sectors ended the day in the green, with technology (+2.51%) and the consumer discretionary (+1.70%) sectors leading the way. The energy sector was the only loser, dropping 1.16% as oil prices traded lower.
The T-Bond market traded higher, pushing the 10-year U.S. Treasury note yield down to 4.001%. Speculation about potential Federal Reserve interest rate cuts has influenced market dynamics, with interest-rate futures traders betting the Fed will cut rates by 150 basis points in 2024, with the first rate cut expected in March.
This week's release of consumer price index and producer price data will be closely monitored for their impact on market sentiment. The stability in the Middle East has kept the oil market surprisingly calm, which may suggest that unless there is a significant increase in instability, oil prices could stay subdued. Lower oil prices would lead to reduced inflation in the coming months.
In November 2023, core consumer price inflation, excluding volatile items like food and energy, remained stable at 4%, aligning with market expectations and marking a two-year low. On a monthly basis, core prices inched up by 0.3%, a slight increase from October's 0.2%.
The broader annual inflation rate also declined to 3.1%, the lowest in five months and slightly below analysts' 3.2% expectations. This decrease was influenced by substantial drops in energy costs, with gasoline, utility gas, and fuel oil prices all declining sharply. Month-over-month, consumer prices increased by 0.1%, with higher shelter costs offsetting a decline in gasoline prices, while core inflation held steady at 4%.
Summary of this S&P 500 technical analysis report:
- The S&P 500 is in an uptrend, nearing resistance levels at 4796.88 and 4820.82. Last week's recovery after a bearish candle indicates upside momentum in the weekly chart, with a potential trading range of 4796 - 4820. If momentum falters, a retest of last week's low at 4663 is possible.
- A strong rally sends the S&P 500 above a crucial support at 4721.50, suggesting potential for higher prices. Traders should monitor signs of institutional buying before committing to the long side though.
- Intraday charts show support levels at 4721.52 and 4726.55, forming a technical confluence area. Institutional buyers may target this range for potential purchases. A bullish scenario involves attracting buyers within this zone, while failure may result in a decline towards 4710.
Read the full S&P 500 technical analysis report below.
S&P 500 technical analysis

Weekly S&P 500 technical analysis
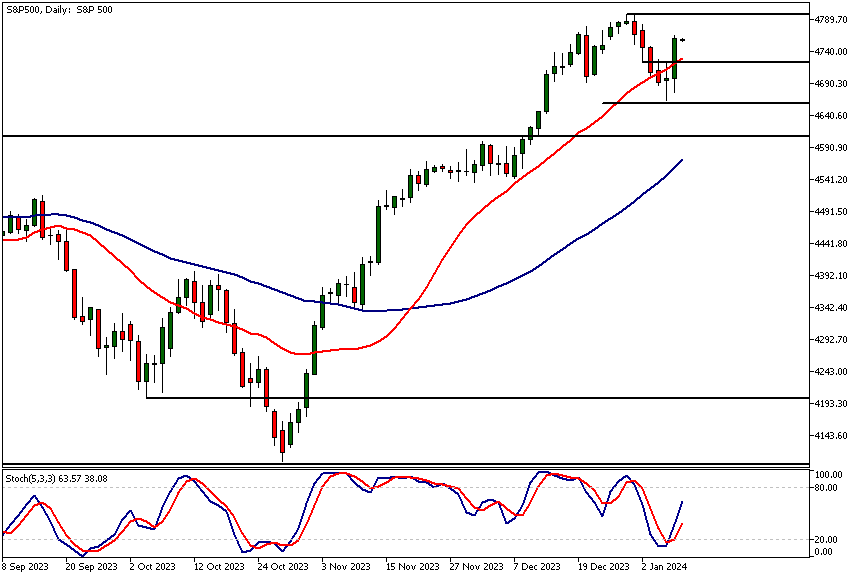
The S&P 500 continues in an uptrend after a drop last week. The market is approaching the December high (4796.88) and the all-time high (ATH) at 4820.82. These levels are evidently resistance levels, and the potential supply at these levels presents a challenge for the bulls in order to sustain the upward momentum.
Last week's candle was bearish, but the market recovered almost as much ground as it lost throughout the week. Consequently, our S&P 500 technical analysis suggests that the risk sentiment remains strong, and the market might continue to trade within the 4796 - 4820 range on the upside.
Alternatively, if the upward momentum falters, look for a retest of last week's low at 4663. Both moving averages are pointing higher, with the SMA(20) above the SMA(50), supporting the bullish view from the price action-based analysis.
Daily S&P 500 technical analysis
Yesterday, the market rallied strongly and is now trading above the previous day's high (4721.50), a critical support level. The bullish wide-range candle from yesterday suggests higher prices, so traders should monitor intraday charts for signs of institutions buying the market at key price levels.
If there are no signs of follow-through buying, traders should consider either staying in cash or looking for short trades. However, given the recent bullishness, market participants may be inclined to buy the dips, which should be considered in your trading plans.
Indicator-based S&P 500 technical analysis aligns with the price action analysis, as both moving averages remain bullish, with the fast SMA(20) above the slow SMA(50). Additionally, note that the stochastic oscillator has given a buy signal and is now trending higher.
Intraday S&P 500 technical analysis
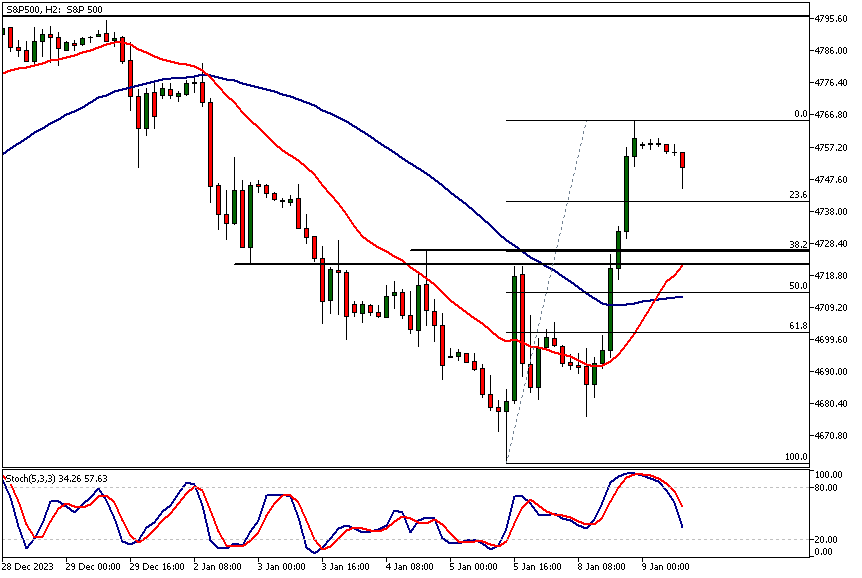
The 2-hour chart shows that the nearest support levels can be found at 4721.52 and 4726.55. Since the 20-period moving average, currently at 4721, and the 38.2 Fibonacci retracement level closely align with the support levels, there is a significant technical confluence area between 4721 and 4726.55.
Therefore, if the market retraces to this confluence zone, our S&P 500 technical analysis suggests that a high number of traders will focus on this price range. In the current context, institutional buyers may view this area as a potential buying opportunity. If the market fails to attract buyers within this price range, we could see it trading down to around 4710.
Client sentiment analysis
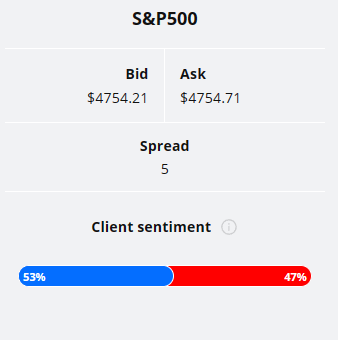
53% of clients trading S&P 500 are holding long positions, while 47% are holding short positions. Client sentiment data is being provided by TIO Markets Ltd.
It’s good to remember that retail client trading sentiment is a contrarian indicator as most retail traders are on average trading against market price trends. This is why experienced traders tend to trade against the retail client sentiment. You can follow the TIOmarkets client sentiment live on our Forex dashboard.
The next key risk events impacting this market:
- USD - 10-y Bond Auction
- USD - Core CPI m/m
- USD - CPI m/m
- USD - CPI y/y
- USD - Unemployment Claims
- USD - 30-y Bond Auction
- USD - Core PPI m/m
- USD - PPI m/m
Potential S&P 500 Market Moves
Intraday charts show support levels at 4721.52 and 4726.55, forming a technical confluence area. Institutional buyers may target this range for potential purchases. A bullish scenario involves attracting buyers within this zone, while failure may result in a decline towards 4710.

How Would You Trade the S&P 500 Today?
I hope this S&P 500 technical analysis report helps you to make better informed trading decisions. Check the latest market analysis for other instruments and subscribe to receive them in your inbox as soon as they are published
DISCLAIMER: TIO Markets offers an exclusively execution-only service. The views expressed are for information purposes only. None of the content provided constitutes any form of investment advice. The comments are made available purely for educational and marketing purposes and do NOT constitute advice or investment recommendation (and should not be considered as such) and do not in any way constitute an invitation to acquire any financial instrument or product. TIOmarkets and its affiliates and consultants are not liable for any damages that may be caused by individual comments or statements by TIOmarkets analysis and assumes no liability with respect to the completeness and correctness of the content presented. The investor is solely responsible for the risk of his/her investment decisions. The analyses and comments presented do not include any consideration of your personal investment objectives, financial circumstances, or needs. The content has not been prepared in accordance with any legal requirements for financial analysis and must, therefore, be viewed by the reader as marketing information. TIOmarkets prohibits duplication or publication without explicit approval.
Join us on social media

Janne Muta holds an M.Sc in finance and has over 20 years experience in analysing and trading the financial markets.
Related Posts


Trade responsibly: CFDs are complex instruments and come with a high risk of losing all your invested capital due to leverage.