Silver Technical Analysis | Long term silver demand should remain robust
BY Janne Muta
|Ocak 9, 2024Silver Technical Analysis – Analysts expect silver prices to be supported by strengthening industrial demand, anticipating a price target of around $26/oz by mid-2024. Factors such as lower interest rates, firmer physical investment, and increased industrial demand are expected to tighten market conditions. Analyst predictions vary from silver prices reaching $26 per ounce by mid-year to $30 in 2025.
Oxford Economics forecasts a remarkable 42% growth in industrial demand for silver between 2023 and 2033. This growth will be driven by sectors such as clean technology and electronics, where silver is crucial for its conductivity properties. As the world embraces green technologies like solar power generation and electric vehicles, silver's role in these sectors will become increasingly significant.
While a recession impacting silver demand is a risk factor, expectations of lowered interest rates should weigh on the dollar and support the price of silver. Furthermore, geopolitical conflicts could drive demand for safe haven assets, including silver.
Summary of This Silver Technical Analysis Report:
- Silver's lower reactionary high at 24.60 suggests short-term bearishness, possibly dropping below the 22.50 support. Indicator-based analysis shows mixed signals, indicating a range-bound market.
- The market faces resistance at 23.53 - 23.65, but bullish sentiment is supported by higher daily lows. Follow-through buying depends on breaking the resistance or risks moving below the 22.50 support. The lower weekly high affects long-side risk appetite.
- The 8-hour chart depicts silver trading sideways within the 22.68 to 23.51 range. An eventual breakout is expected, with measured move targets at 24.35 (bullish) or 21.82 (bearish). The lower weekly high suggests potential downside, emphasizing the need for multiple time frame analysis.
Read the full Silver technical analysis report below.
Silver Technical Analysis

Weekly Silver Technical Analysis
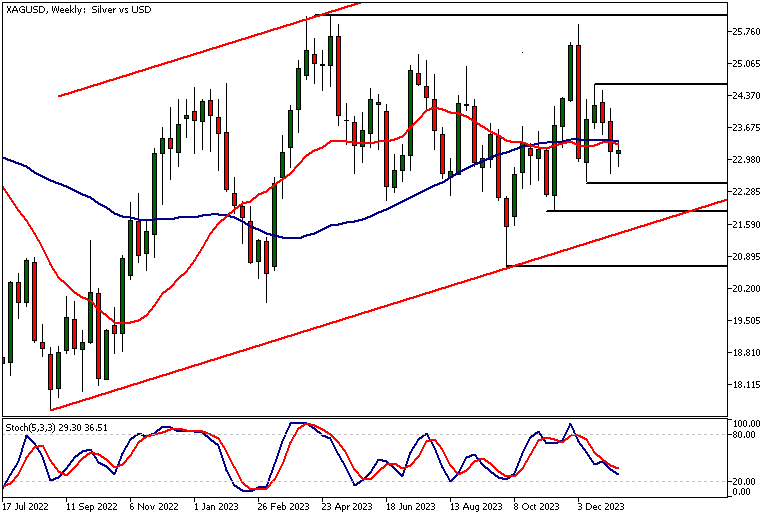
Silver has formed a lower reactionary high at 24.60 and has been trading lower since. This may eventually result in the silver market dipping below the 22.50 support level. While the market maintains a long-term upward bias, a lower weekly swing high signals short-term bearishness.
Indicator-based silver technical analysis provides mixed signals with the SMAs moving sideways. At the same time, the stochastic oscillator is pointing lower, signalling a loss of momentum. Note that the oscillator is not far from the oversold threshold of 20. The indicator-based analysis suggests that the market is almost range-bound and lacks a clear direction.
In a market like this, traders should focus on smaller time frame charts to find tradable setups and consider keeping price targets relatively close.

Daily Silver Technical Analysis
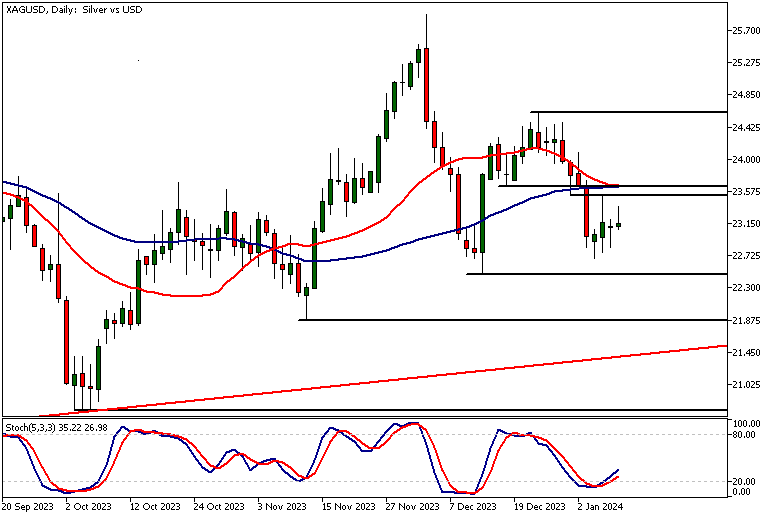
The nearest resistance area at 23.53 – 23.65 proved to be challenging for the bulls, leading to a market drop to 22.83 after a rally attempt. This area coincides with both SMAs (20 and 50 periods), suggesting it could remain an important resistance.
However, this hasn't deterred silver bulls from attempting to push the market higher: The market has created two higher daily lows after a bullish rejection candle formed five days ago, encouraging traders to buy silver.
Nonetheless, follow-through buying depends on penetrating the 23.53 - 23.65 resistance area. The lack of follow-through buying at the moment may be attributed to the lower reactionary high on the weekly chart, potentially discouraging some market participants from taking long positions. If the market cannot breach this resistance area, we may see a move below the nearest support level at 22.50.

Intraday Silver Technical Analysis
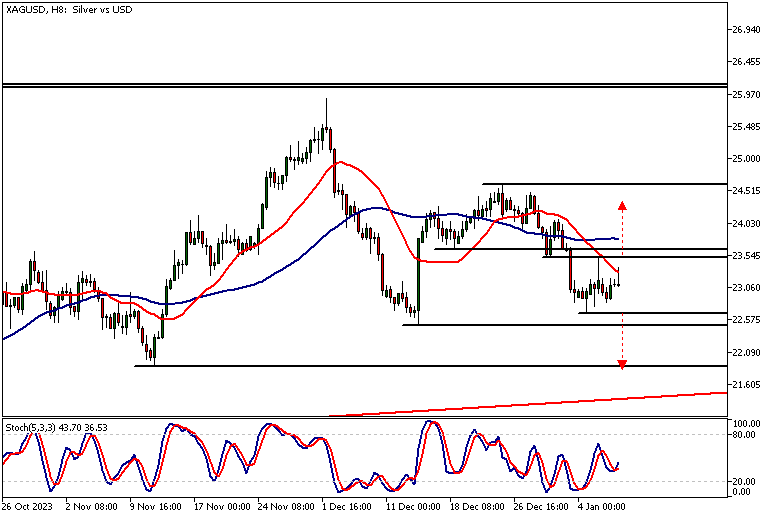
The 8-hour chart shows the market trading sideways between the range low at 22.68 and the range high at 23.51. It is certain that the market will eventually break out of this sideways range, and we could see silver moving to measured move targets based on the width of the trading range.
The measured move target above the range is at 24.35, and below the range, the target is at 21.82. The lower target coincides with a major support level formed in November. Due to the presence of a lower reactionary high on the weekly chart, our silver technical analysis indicates that the sideways move could resolve to the downside.
However, because it's not possible to update this analysis on a daily basis, traders should always focus on price action in multiple time frames to gain a better understanding of the market's likely direction at any given time.

Client sentiment analysis
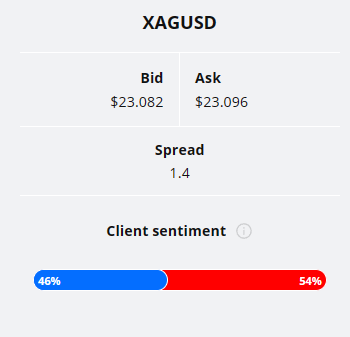
46% of clients trading XAGUSD are holding long positions, while 54% are holding short positions. Client sentiment data is being provided by TIO Markets Ltd.
It’s good to remember that retail client trading sentiment is a contrarian indicator as most retail traders are on average trading against market price trends. This is why experienced traders tend to trade against the retail client sentiment. You can follow the TIOmarkets client sentiment live on our Forex dashboard.
The next key risk events impacting this market
- USD - 10-y Bond Auction
- USD - Core CPI m/m
- USD - CPI m/m
- USD - CPI y/y
- USD - Unemployment Claims
- USD - 30-y Bond Auction
- USD - Core PPI m/m
- USD - PPI m/m
Potential Silver Market Moves
Bullish: If silver breaks above 23.53 - 23.65 resistance, it may target 24.35 on the daily, with potential for an extended bullish trend.
Bearish: Failure to breach resistance may lead to a downside move below 22.50 on the daily, with a target at 21.82 on the intraday chart, aligning with the lower weekly high.

How Would You Trade Silver Today?
I hope this silver technical analysis helps you to make better informed trading decisions. Check the latest market analysis for other instruments and subscribe to receive them in your inbox as soon as they are published
DISCLAIMER: TIO Markets offers an exclusively execution-only service. The views expressed are for information purposes only. None of the content provided constitutes any form of investment advice. The comments are made available purely for educational and marketing purposes and do NOT constitute advice or investment recommendation (and should not be considered as such) and do not in any way constitute an invitation to acquire any financial instrument or product. TIOmarkets and its affiliates and consultants are not liable for any damages that may be caused by individual comments or statements by TIOmarkets analysis and assumes no liability with respect to the completeness and correctness of the content presented. The investor is solely responsible for the risk of his/her investment decisions. The analyses and comments presented do not include any consideration of your personal investment objectives, financial circumstances, or needs. The content has not been prepared in accordance with any legal requirements for financial analysis and must, therefore, be viewed by the reader as marketing information. TIOmarkets prohibits duplication or publication without explicit approval.
Join us on social media

Janne Muta holds an M.Sc in finance and has over 20 years experience in analysing and trading the financial markets.
Related Posts
Trade responsibly: CFDs are complex instruments and come with a high risk of losing all your invested capital due to leverage.


