ABCD Pattern: A complete guide for Forex traders
BY Stefanos Mitsi
|March 2, 2026If you're looking for a straightforward chart pattern that provides clear trading signals, the ABCD pattern deserves your attention. This four-point formation appears across all timeframes and markets, giving traders a structured approach to identifying potential reversals and continuation moves.
The ABCD pattern is popular because it reflects natural market rhythm by the way prices move in waves of impulse and correction. When you learn to recognize this pattern, you gain insights in timing your entries and exits with greater precision.
In this guide, we'll walk you through everything you need to know about the ABCD pattern. You'll learn how to identify it on your charts, understand what makes it valid, and discover practical strategies for trading it effectively. Whether you're trading forex, commodities, or indices, this pattern can become a valuable addition to your technical analysis toolkit.
Let’s get started.
What is the ABCD Pattern?
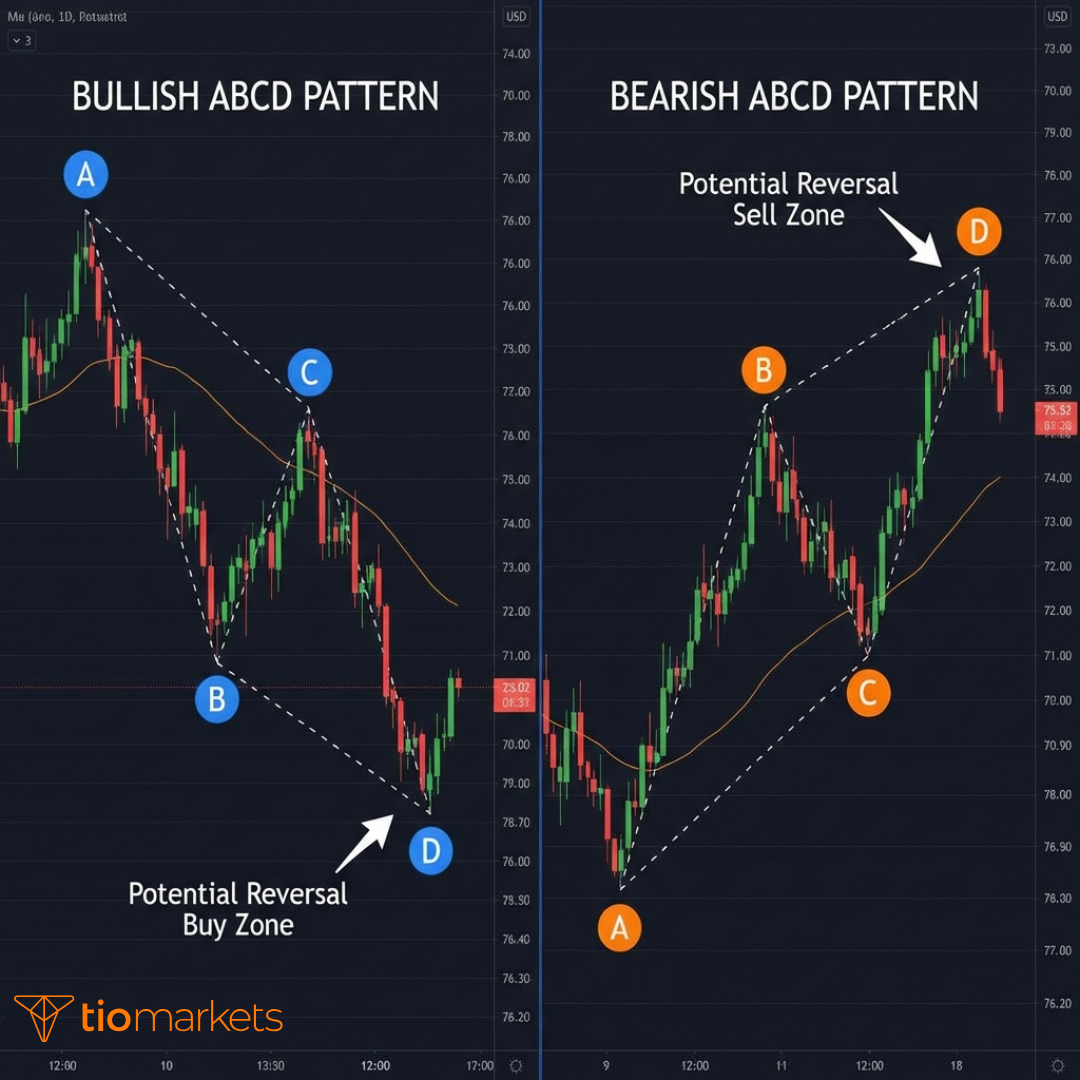
The ABCD pattern is a price structure consisting of four distinct points—labeled A, B, C, and D - that form a specific geometric relationship on your price chart. Each point represents a significant swing high or swing low, creating a visual pattern that traders use to anticipate where price might reverse or continue.
Here's the basic structure:
- Point A marks the start of the pattern (initial swing high or low)
- Point B represents the first retracement (pullback from A)
- Point C shows the second impulse move (continuation from B, but not exceeding A)
- Point D indicates the completion point where the pattern finishes and a potential reversal occurs
The pattern appears in both bullish and bearish variations, giving you opportunities to trade in rising and falling markets. What makes the ABCD pattern particularly useful is its clear structure—once you understand the basic formation, you can spot it relatively quickly on any chart or timeframe.
Understanding the ABCD Pattern Structure
The ABCD pattern belongs to the family of harmonic patterns, which means it follows specific geometric and mathematical relationships. Don't let that intimidate you—the concept is simpler than it sounds.
At its foundation, the ABCD pattern captures how markets naturally move. Prices don't travel in straight lines. Instead, they advance in waves - moving forward, pulling back, then moving forward again. The ABCD pattern gives structure to these waves, helping you identify where the next significant move might occur.
This pattern appears consistently across different markets and timeframes. You'll find it on 5-minute charts if you're scalping, on hourly charts for day trading, and on daily charts for swing trading. The principles remain the same regardless of your trading style or preferred timeframe.
What makes the ABCD pattern valuable is its frequency and reliability. Once you train your eye to recognize the formation, you'll start seeing trading opportunities you might have previously missed. The pattern provides both entry signals and clear risk management parameters, which is exactly what you need for consistent trading.
How to Recognize the ABCD Pattern on Your Charts
Spotting an ABCD pattern becomes easier once you understand what you're looking for. The pattern creates a distinctive zigzag formation that stands out from surrounding price action.
Start by identifying point A - this is your initial swing point. In a bullish ABCD pattern, point A is a swing low where price bounces upward. In a bearish pattern, point A is a swing high where price reverses downward.
From point A, price moves to point B, creating the first leg of the pattern. This AB leg establishes the pattern's direction and momentum. Look for a clear, decisive move between these two points. If the price movement looks choppy or uncertain, the pattern may not be reliable.
After reaching point B, price retraces back toward point A, but doesn't exceed it. This creates point C. The BC retracement is crucial - it represents a temporary pullback, not a complete reversal. Point C should show less momentum than the initial AB move, indicating the market is pausing rather than changing direction entirely.
Finally, the price moves from C to D, completing the pattern. The CD leg often mirrors the AB leg in both distance and time, creating the pattern's characteristic symmetry. Point D is where you'll focus your trading attention - it represents the high-probability zone for a reversal.
Visual Cues to Look For:
- Clear, distinct swing points that stand out on your chart
- Relatively equal distance between the AB leg and CD leg
- A retracement at point C that stays within the pattern's boundaries
- Smooth price flow between points without excessive noise or choppiness
- Symmetry in both price distance and time between the two legs
The pattern should look clean and obvious. If you're squinting at your chart trying to force a pattern into existence, it's probably not there. The best ABCD patterns are the ones that jump out at you immediately.
Breaking Down Each Point: A, B, C, and D
Understanding what each point represents helps you trade the pattern with confidence. Let's examine each one in detail.
Point A: Where It All Begins
Point A is your starting point. In a bullish ABCD pattern, this is a significant swing low—a point where price has stopped falling and begins to rise. In a bearish pattern, it's a swing high where price stops rising and starts to fall.
This point often appears after a period of consolidation or at the end of a previous trend. You're looking for a clear pivot where price changes direction with conviction. Point A sets the foundation for everything that follows, so it needs to be a well-defined swing point, not just a minor fluctuation.
Point B: The First Reversal
Point B marks the first major reversal in the pattern. From A to B, price makes its initial impulse move. In a bullish pattern, price rises from A to B. In a bearish pattern, price falls from A to B.
The AB leg is important because it establishes the pattern's momentum and provides the measurement you'll use to project where point D might form. Strong, decisive movement during the AB leg typically indicates a more reliable pattern. If the AB move looks weak or hesitant, the pattern may not play out as expected.
Point C: The Retracement
Point C is where price pulls back from the initial AB move. This retracement is essential for pattern validity. Point C must not exceed point A - if it does, the pattern is invalidated and you should look elsewhere for trading opportunities.
The BC leg typically shows decreased momentum compared to the AB leg. This is what you want to see - it indicates a temporary pause in the trend rather than a complete reversal. The retracement at point C creates the setup for the final move to point D.
One key characteristic of point C: it should represent a significant retracement of the AB leg, but not a complete reversal. You're looking for a pullback that gives the market room to breathe before continuing in the original direction.
Point D: The Completion and Trading Zone
Point D is where the pattern completes and where most of your trading decisions happen. This is the high-probability reversal zone - the area where you'll consider entering a position.
The CD leg should be approximately equal to the AB leg in terms of price distance. This symmetry is what makes the pattern predictable and tradeable. Point D represents your primary area of interest because it offers a clear entry point with well-defined risk parameters.
In a bullish ABCD pattern, point D marks a potential buying opportunity - you're looking for a price to reverse upward from this level. In a bearish pattern, point D signals a potential selling opportunity where price might reverse downward.
What makes point D particularly valuable is the clarity it provides. You know where to enter, where to place your stop loss (just beyond point D), and where to target your profit (often back toward point B or beyond). This clear structure removes much of the guesswork from trading.
Understanding these four points and how they relate to each other is fundamental to successfully trading the ABCD pattern. Each point tells you something specific about market structure and potential future price movement, giving you a complete framework for making informed trading decisions.
Bullish ABCD Pattern vs Bearish ABCD Pattern
The ABCD pattern comes in two variations - bullish and bearish. Each offers distinct trading opportunities depending on market direction. Understanding both versions helps you identify potential trades in any market condition.
Bullish ABCD Pattern: Trading the Upside
A bullish ABCD pattern forms when price is declining or has reached a potential bottom. This pattern signals a possible upward reversal, giving you an opportunity to enter long positions.
Here's how the bullish pattern develops:
Point A starts at a swing high. Price then declines to point B, creating a swing low. This AB leg represents the initial downward move. From point B, price retraces upward to point C, which must remain below point A to keep the pattern valid. Finally, price declines again from C to D, typically reaching or slightly exceeding the level of point B.
Key characteristics of bullish ABCD patterns:
- Forms during downtrends or after significant price declines
- Point D represents your potential buying opportunity
- Suggests selling pressure is exhausting
- Often appears at support levels or round psychological numbers
- Completion at point D may coincide with oversold readings on momentum indicators
When trading a bullish ABCD pattern, you wait for price to reach point D before taking action. Don't jump in early—let the pattern complete. Once price reaches point D, look for confirmation signals such as bullish candlestick patterns, momentum divergence, or a break above recent resistance before entering your long position.
Bearish ABCD Pattern: Trading the Downside
A bearish ABCD pattern develops during uptrends or at potential market tops. This formation indicates a possible downward reversal, creating opportunities for short positions.
The bearish pattern forms like this:
Point A begins at a swing low. Price rises to point B, forming a swing high and creating the initial upward AB leg. From B, price retraces downward to point C, which must stay above point A. The final CD leg pushes price higher to point D, typically reaching or slightly exceeding point B's level.
Key characteristics of bearish ABCD patterns:
- Forms during uptrends or after significant rallies
- Point D represents your potential selling opportunity
- Indicates buying pressure may be exhausting
- Often appears at resistance levels or psychological barriers
- Completion may align with overbought conditions on technical indicators
Trading bearish ABCD patterns requires patience. Wait for price to reach point D, then look for reversal confirmation before entering short positions. This confirmation might include bearish candlestick formations, negative momentum divergence, or a break below recent support.
The main difference between bullish and bearish patterns is simply direction, the structure and trading approach remain consistent. Master one, and you've essentially mastered both.
The Psychology Behind Each Leg
AB Leg: Initial Impulse and Conviction
The AB leg represents the initial market impulse, often driven by fresh information, a sentiment shift, or a technical breakout. During this phase, one side - either buyers or sellers - gains clear control and pushes price decisively in one direction.
This move often catches many traders off-guard, creating strong directional momentum. Early participants who recognize the move profit handsomely, while those on the wrong side scramble to exit positions. The AB leg is characterized by conviction and follow-through.
BC Leg: Profit-Taking and Uncertainty
As price reaches point B, early participants begin taking profits. Others start questioning whether the move has extended too far. This creates the BC retracement.
Market psychology during this phase shifts from confidence to uncertainty. Some traders exit their positions to lock in gains. Others wait on the sidelines, wondering if the original move will continue or reverse completely. The depth of the BC retracement often reflects the market's conviction about the initial AB move - shallow retracements suggest strong conviction, while deeper retracements indicate more doubt.
CD Leg: FOMO and Final Push
The CD leg represents the final push where fear of missing out (FOMO) drives late participants into the market. Traders who missed the AB move or exited during the BC retracement now chase price, pushing it toward point D.
However, this move typically lacks the conviction of the original AB leg. Volume often decreases, momentum weakens, and the move becomes more labored. As price approaches point D, early traders from the AB move take profits again, while contrarian traders begin positioning for a reversal.
Point D: Exhaustion and Reversal
Point D represents market exhaustion - the point where the last buyers (in a bearish pattern) or last sellers (in a bullish pattern) enter at the worst possible price. This is where retail traders are fully committed to the trend direction, while professional traders position for the reversal.
The psychology at point D involves:
Maximum optimism (in bearish patterns) or maximum pessimism (in bullish patterns)
Retail traders fully committed to continuing the trend
Professional traders looking for reversal opportunities
Technical levels attracting algorithmic trading activity
Exhaustion of the move that began at point A
Why These Patterns Keep Repeating
ABCD patterns recur because human psychology in markets remains consistent. Traders repeatedly exhibit the same behaviors:
- Chasing moves after they've already extended (creating point D)
- Taking profits at predictable levels (creating point C)
- Entering on breakouts (creating point B)Recognizing value at extremes (reversing from point D)
The ABCD pattern essentially captures a complete market cycle - impulse, retracement, final push, and exhaustion. This cycle repeats across all timeframes because it represents fundamental human trading behaviors that don't change regardless of technology, market evolution, or trading platforms.
Common Mistakes When Trading ABCD Patterns
Understanding common errors helps you avoid costly mistakes. Here are the biggest pitfalls traders face with ABCD patterns.
1. Forcing Patterns That Don't Exist
Many traders see ABCD patterns everywhere, leading to trading invalid patterns with poor structure, ignoring price action that doesn't fit the model, creating patterns by cherry-picking swing points, and trading in choppy, rangebound conditions where patterns don't work well.
Solution: Only trade clear, well-defined patterns that meet all criteria. If you have to squint or adjust your analysis to see the pattern, it's not valid. The best patterns are obvious - they jump off the chart at you.
2. Ignoring Market Context
Trading patterns in isolation without considering the overall trend direction, key support and resistance levels, fundamental factors affecting the currency pair, and time of day and session characteristics.
Solution: Always analyze the bigger picture before trading any pattern. ABCD patterns work best when aligned with larger market forces. A bullish ABCD pattern in a strong downtrend has lower probability than one forming at a major support level in an uptrend.
3. Poor Risk Management
Common risk management failures include using stops that are too tight, getting stopped out prematurely, risking too much per trade hoping for home runs, not adjusting position size for stop distance, and moving stops to breakeven too quickly before the trade has room to develop.
Solution: Stick to consistent risk parameters regardless of how perfect the pattern looks. Professional trading is about managing losses, not just maximizing wins. Risk 1-2% per trade, every trade, without exception.
4. Entering Too Early
Impatient traders often enter before price reaches projected point D, trade without waiting for confirmation, chase price after missing the ideal entry, and let FOMO (fear of missing out) drive them into positions.
Solution: Patience is crucial. Wait for the price to reach your predetermined levels and show confirmation before entering. Missing a trade is always better than taking a bad entry. There will be another ABCD pattern tomorrow, next week, and next month.
5. Neglecting Multiple Timeframe Analysis
Trading without checking higher timeframe trend direction, lower timeframe entry precision, pattern confluence across timeframes, and key levels on different timeframes.
Solution: Always analyze at least three timeframes before trading. Check the daily chart for overall trend, the 4-hour chart for pattern structure, and the 1-hour chart for precise entry timing. The pattern should make sense within the larger market structure.
6. Overcomplicating the Strategy
Adding too many indicators or rules by using numerous confirmation indicators that conflict, creating complex entry rules that rarely align, waiting for perfect conditions that never occur, and suffering from analysis paralysis that prevents trade execution.
Solution: Keep your ABCD pattern trading simple. Master the basic pattern before adding additional filters or indicators. The pattern itself provides everything you need—entry point, stop loss level, and profit targets. Additional indicators should confirm what the pattern already tells you, not create confusion.
By avoiding these common mistakes, you significantly improve your ABCD pattern trading results. Remember, successful trading isn't about being right all the time—it's about managing risk effectively and executing your strategy consistently over many trades.
Conclusion: Mastering the ABCD Pattern
The ABCD pattern remains one of the most accessible and effective tools in forex technical analysis. Its clear structure, defined entry and exit points, and basis in market psychology make it valuable for traders at all experience levels.
Remember that successful trading requires more than just pattern recognition. You need solid risk management, proper position sizing, emotional discipline, and realistic expectations. The ABCD pattern provides the framework, but your execution determines the results.
Start by practicing on demo accounts until you can consistently identify and trade patterns correctly. Then transition to small live positions to experience real market conditions without significant risk. As your confidence and skill grow, you can gradually increase position sizes while maintaining strict risk management.

FAQ
Risk disclaimer: CFDs are complex instruments and come with a high risk of losing money rapidly due to leverage. You should consider whether you understand how CFDs work and whether you can afford to take the high risk of losing your money. Never deposit more than you are prepared to lose. Professional client’s losses can exceed their deposit. Please see our risk warning policy and seek independent professional advice if you do not fully understand. This information is not directed or intended for distribution to or use by residents of certain countries/jurisdictions including, but not limited to, USA & Countries included in the OFAC sanction list. The Company holds the right to alter the aforementioned list of countries at its own discretion.
TIOmarkets offers an exclusively execution-only service. The views expressed are for information purposes only. None of the content provided constitutes any form of investment advice. The comments are made available purely for educational and marketing purposes and do NOT constitute advice or investment recommendation (and should not be considered as such) and do not in any way constitute an invitation to acquire any financial instrument or product. TIOmarkets and its affiliates and consultants are not liable for any damages that may be caused by individual comments or statements by TIOmarkets analysis and assumes no liability with respect to the completeness and correctness of the content presented. The investor is solely responsible for the risk of his/her investment decisions. The analyses and comments presented do not include any consideration of your personal investment objectives, financial circumstances, or needs. The content has not been prepared in accordance with any legal requirements for financial analysis and must, therefore, be viewed by the reader as marketing information. TIOmarkets prohibits duplication or publication without explicit approval.
Join us on social media
Authors BIO

Stefanos is a seasoned financial markets executive with deep expertise in forex, CFDs, and global brokerage leadership. He has held senior leadership roles across multiple regulated financial services firms. He is also a passionate content creator and wants to share his knowledge to the world.


