AUDCAD Analysis | 3.8% Rally Ahead Of The RBA Rate Decision
BY Janne Muta
|November 6, 2023AUDCAD Analysis - While the lower crude oil prices have pressured the AUDCAD has rallied on the back of expectations that the Reserve Bank of Australia could hike the rates either tomorrow or by the year's end.
As the Australian economy is showing signs of a slowdown the central bank (RBA), led by Governor Michele Bullock, is approaching its next rate decision with caution. While inflation (5.6%) has receded from its peak since December 2022, it remains stubbornly above the target and a slowing economy doesn't make it easy to hike the rates.
The RBA's hold on rates in October 2023 underscores a strategy to combat service inflation without stifling growth. Employment and business conditions remain strong, mitigating the impact of slightly weakened retail sales. The central bank is expected to raise interest rates, if not tomorrow, then possibly by the year-end, depending on how the economy is doing.
Against this background today's Canadian PMI release could be overshadowed by the RBA rate decision tomorrow. However, the PMI numbers could still provide added volatility to the market, especially if the actual reading deviates strongly from the expected number.
Summary of This AUDCAD Analysis Report:
- The AUDCAD pair rebounded from a double bottom in the weekly chart. The market is now facing resistance at the 61.8% Fibonacci level with potential upside despite bearish trends and an overbought stochastic reading. Next resistance at 0.9056.
- AUDCAD rallied to the 61.8% Fibonacci level, meeting profit-taking before closing above the channel high. Support is at 0.8835, with potential to reach 0.9020 or drop to 0.8764 if breached.
- The 4-hour chart indicates that the market is potentially forming a double top, with the neckline of the formation at 0.8831. If this pattern resolves to the downside, a move towards approximately 0.8764 is anticipated.
Read the full AUDCAD analysis report below.
AUDCAD Technical Analysis
Weekly AUDCAD Analysis
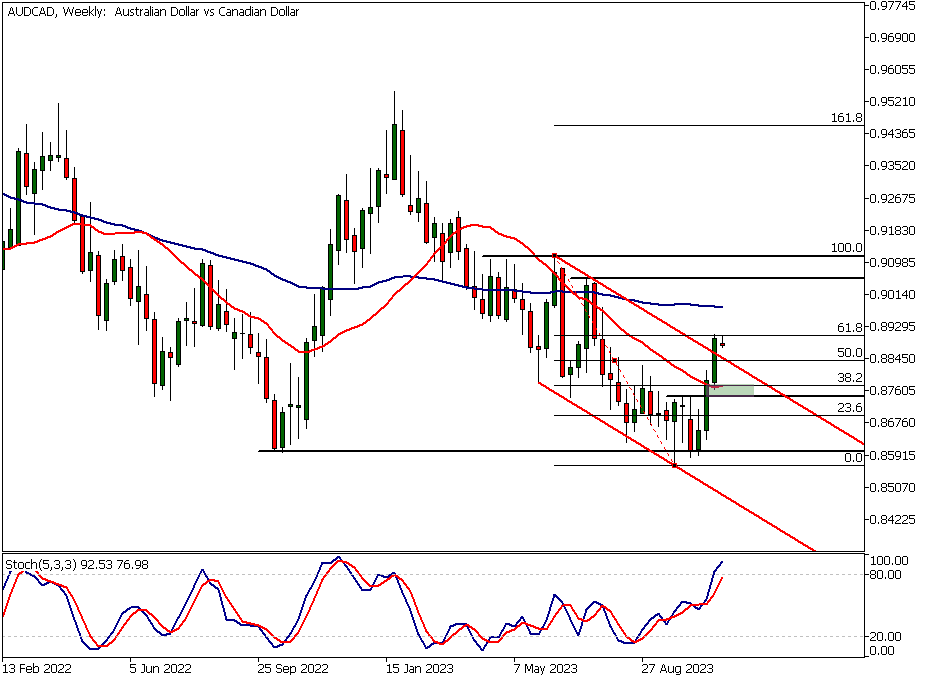
In the weekly chart, AUDCAD created a double bottom close to the October 2022 low at 0.8604. This was followed by a 3.6% rally, which was mostly halted by the 61.8% Fibonacci retracement level last week.
Further AUDCAD analysis shows the market trying to also break outside of a bearish trend channel. Last week's close was above the channel's high, and the strong upside momentum suggests that even if the AUDCAD retraces some of the earlier move, there could be more upside ahead.
The technical indicators in this timeframe are still bearish, though. The 20-period moving average is below the 50 SMA, and the moving averages are pointing lower. At the same time, the stochastic oscillator is in the overbought area with the current reading of 92.52.
The AUDCAD analysis shows the nearest technical confluence area can be found at 0.8745 - 0.8773, while the next significant resistance level is at 0.9056.
Daily GBPJPY Technical Analysis
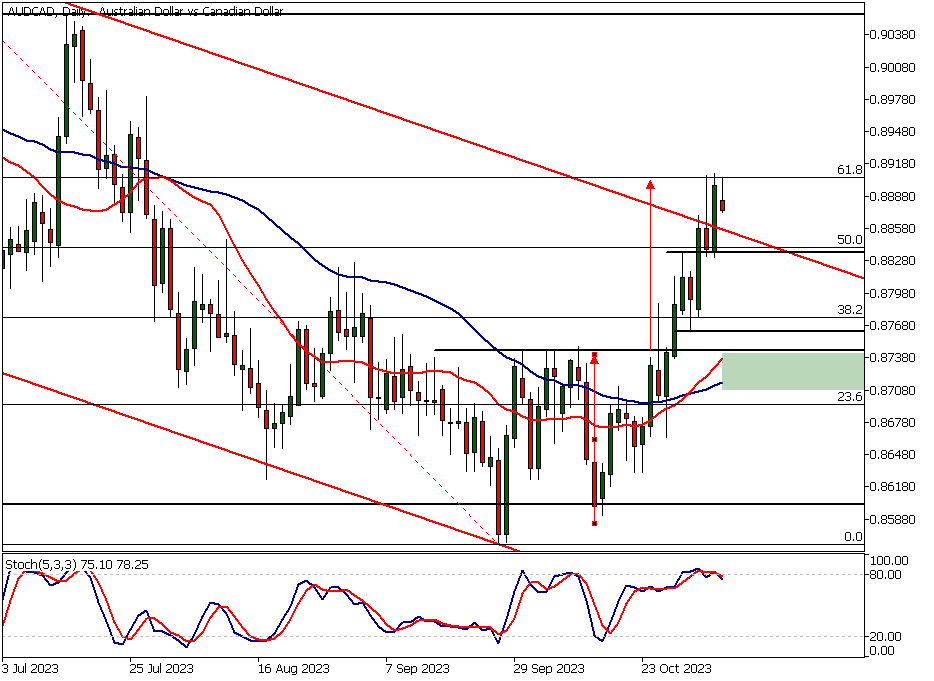
The daily chart shows the market rallied exactly the measured move from the base formed in October, reaching the 61.8% Fibonacci retracement level. The market hit this level on Thursday but was pushed lower by profit-taking.
On Friday, the market rallied to the level again and closed above the bearish channel high. The nearest major support level in the daily timeframe chart is a market structure level at 0.8835, which coincides with the 38.2% Fibonacci retracement level. Above this level, a move to 0.9020 is possible.
AUDCAD analysis shows that if this level does not hold, the market could trade down to 0.8764. The two moving averages are currently below the 0.8744 market structure level, thus creating a confluence area between 0.8715 - 0.8744.
AUDCAD Analysis, 4h Chart
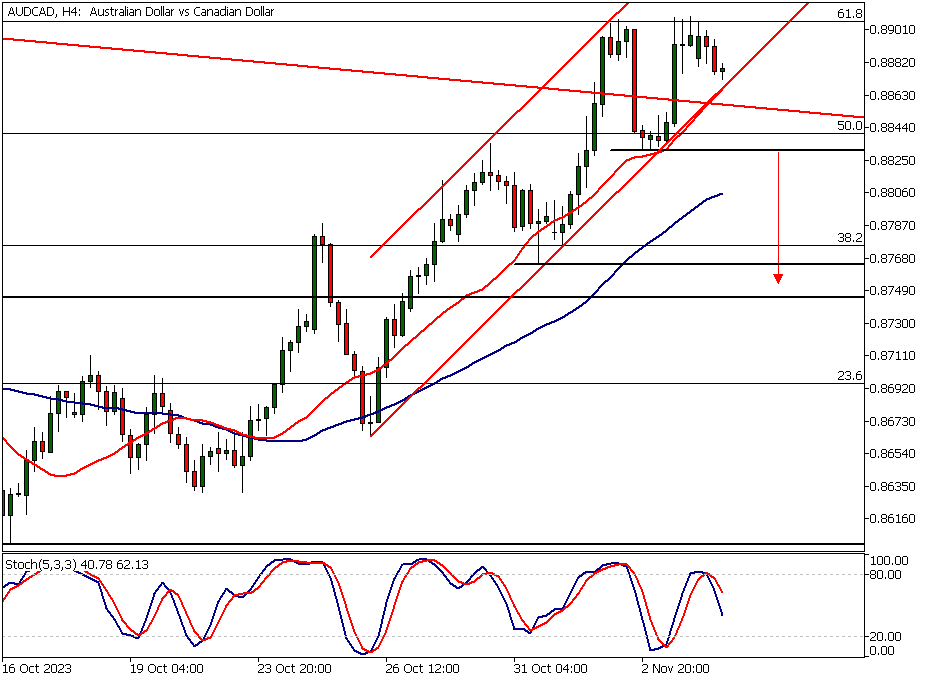
The 4-hour chart indicates that the market is potentially forming a double top, with the neckline of the formation at 0.8831. If this pattern resolves to the downside, a move towards approximately 0.8764 is anticipated.
This level is validated by a swing low at this price level at the end of October, and the measured move based on the double top formation also points to this same price region. Technical AUDCAD analysis shows how the moving averages are still pointing higher, indicating continued upside momentum. This aligns with the AUDCAD analysis on the weekly and daily timeframes.
Client sentiment analysis
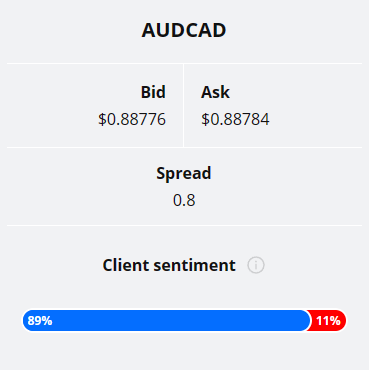
TIOmarkets' clientele are strongly bullish on AUDCAD, with 89% of clients holding long positions and only 11% betting the market will fall.
Please remember that the retail trader client sentiment is a contrarian indicator as most of the retail traders are on average betting against the market trends. This is why, experienced traders tend to trade against the retail client sentiment. You can follow the TIOmarkets client sentiment live on our Forex dashboard.
The next key risk events impacting this market:
- CAD Ivey PMI
- RBA Cash Rate
- RBA Rate Statement
- RBA Monetary Policy Statement

Potential AUDCAD Market Moves
The AUDCAD's breakout above the bearish channel and close above key resistance signals potential upside. With the 4-hour moving averages trending upward and support at 0.8835, a sustained move could target 0.9020, aligning with weekly and daily momentum.
Despite recent gains, the AUDCAD faces pressure with a potential double top on the 4-hour chart. A break below the 0.8831 neckline could trigger a drop towards 0.8764, supported by the confluence area.
How would you trade the AUDCAD today?
I hope this fundamental and technical AUDCAD analysis helps you to make better informed trading decisions. Check the latest market analysis for other instruments and subscribe to receive them in your inbox as soon as they are published
DISCLAIMER: TIO Markets offers an exclusively execution-only service. The views expressed are for information purposes only. None of the content provided constitutes any form of investment advice. The comments are made available purely for educational and marketing purposes and do NOT constitute advice or investment recommendation (and should not be considered as such) and do not in any way constitute an invitation to acquire any financial instrument or product. TIOmarkets and its affiliates and consultants are not liable for any damages that may be caused by individual comments or statements by TIOmarkets analysis and assumes no liability with respect to the completeness and correctness of the content presented. The investor is solely responsible for the risk of his/her investment decisions. The analyses and comments presented do not include any consideration of your personal investment objectives, financial circumstances, or needs. The content has not been prepared in accordance with any legal requirements for financial analysis and must, therefore, be viewed by the reader as marketing information. TIOmarkets prohibits duplication or publication without explicit approval.

Janne Muta holds an M.Sc in finance and has over 20 years experience in analysing and trading the financial markets.
Related Posts


Trade responsibly: CFDs are complex instruments and come with a high risk of losing all your invested capital due to leverage.