AUDUSD technical analysis | AUD Falls After The RBA hikes 25 bp
BY Janne Muta
|November 7, 2023AUDUSD Technical Analysis - AUDUSD has traded lower after the RBA rate hike (25 bp) was confirmed to be in line with market expectations. At the same time, the USD has been recovering across the board following Minneapolis Fed President Kashkari said more rate hikes could be needed to bring inflation under control.
The US bond market reacted by hitting the bids, which moved the yields higher (lower bond prices mean higher yields). Helping the US dollar to rally across the board and push the major US counterparts lower.
Summary of This AUDUSD Technical Analysis Report:
- The AUDUSD currency pair is resuming its downtrend after a rally failed at a major resistance level at 0.6522. The 38.2% Fibonacci retracement level and the 20-period SMA are closely aligned with this important market structure level.
- The market remains bearish unless the 0.6400 level attracts buyers and bounces the market significantly higher. Otherwise, the AUDUSD would likely trade down to 0.6314, and then perhaps to the 0.6270 low.
- The US bond market has been selling after the Fed President Kashkari said more rate hikes could be needed. The yields moved higher helping the US dollar to rally across the board and push the major US counterparts lower.
Read the full AUDUSD Technical Analysis report below.
AUDUSD Technical Analysis
Weekly AUDUSD Technical Analysis
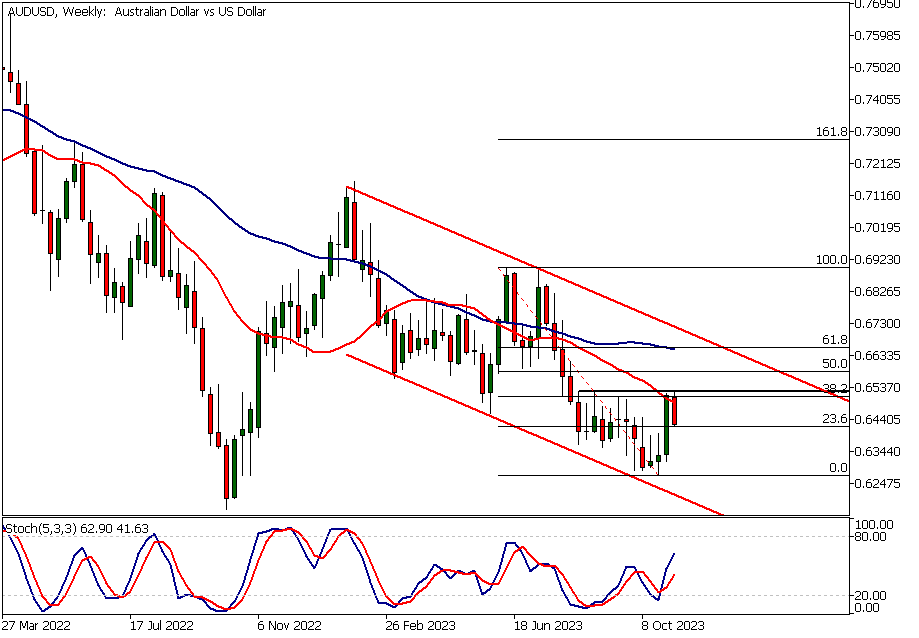
The AUDUSD currency pair is resuming its downtrend after a rally failed at a major resistance level at 0.6522. The 38.2% Fibonacci retracement level and the 20-period SMA are closely aligned with this important market structure level. Therefore, it could be that this level defines the price action in AUDUSD over the coming weeks.
Moving Averages Point Lower
Both moving averages are pointing lower, and the market is creating lower lows on the weekly chart. The inability to penetrate the 0.6522 level and the strong download from the level suggest that AUDUSD could be trading down to the 0.6270 low.
Alternatively our AUDUSD technical analysis shows that, if the bulls were able to create a higher swing low above the 0.6270 low and overcome the supply at 0.6522, we could see the market trading to the 61.8% Fibonacci retracement level. The level coincides with the 50-period SMA and is relatively close to the bearish trend channel high.
Daily AUDUSD Technical Analysis
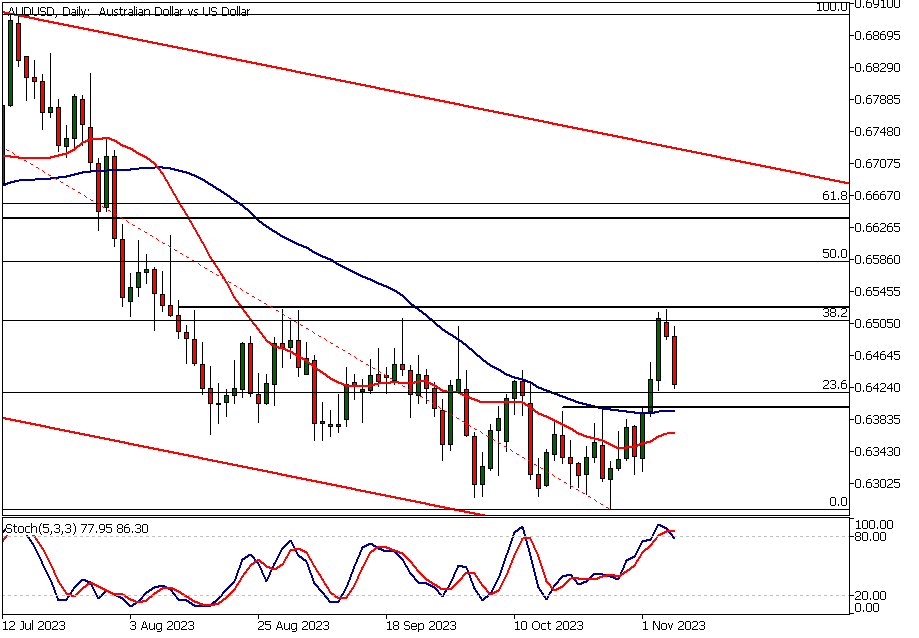
In the daily chart, the stochastic oscillator has just given a sell signal after the indicator moved into the overbought area. However, the market is approaching a potential support level that could at least pause the down move.
The Key Price Level at 0.6400
This market structure level on the daily chart coincides with the 50-period moving average near the 0.6400 round number. As per our AUDUSD technical analysis The market remains bearish unless this level attracts buyers and bounces the market significantly higher. Otherwise, the AUDUSD would likely trade down to 0.6314, and then perhaps to the 0.6270 low.
AUDUSD Technical Analysis, 4h Chart
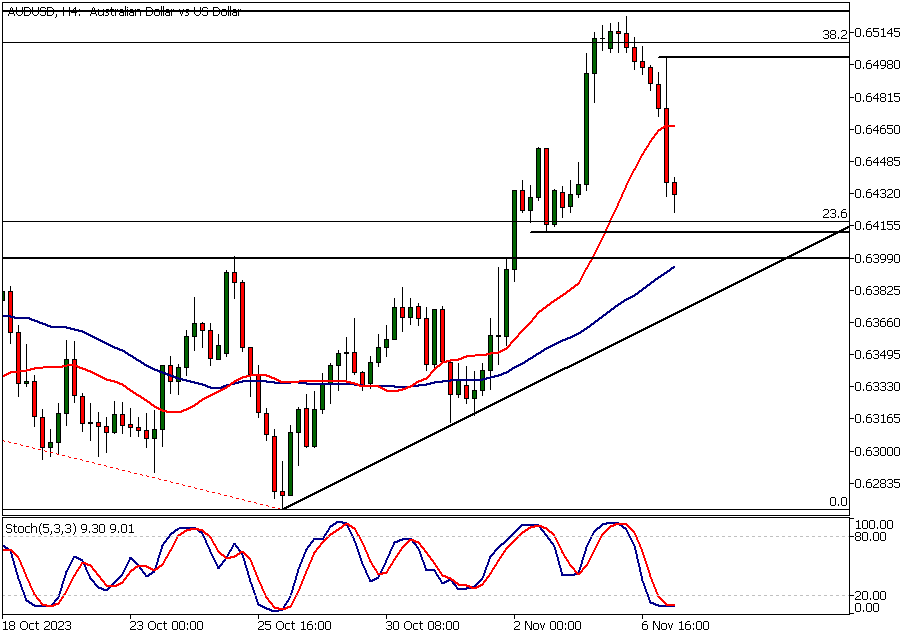
The 4-hour chart shows the market approaching a minor support level at 0.6413. The level coincides with the 23.6% Fibonacci retracement level, creating a technical confluence level.
Note that a confluence level created by the 0.6400 level and the 50-period SMA is somewhat close to this level, suggesting the area is a significant market structure area and support. The strong down move has taken the stochastic oscillator into oversold territory. The nearest resistance level on the 4-hour chart is at 0.6501.
Monitoring Price Action
The market is trading near levels that could potentially attract intraday traders to buy the market. However, when trading we should not anticipate, but instead react to the unfolding price action.
If there is a reaction higher from the 4-hour levels, the upside could be limited due to the major resistance level at 0.6522. See the weekly AUDUSD technical analysis above. Also, if the dollar continues recovering across the board as it is at the moment, we could see more downside in AUDUSD.
Client sentiment analysis
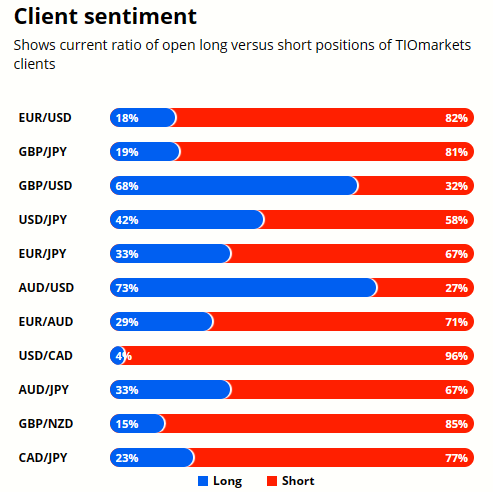
TIOmarkets' clientele are bullish on AUDUSD, with 73% of clients holding long positions and only 27% shorting the market.
Please remember that the retail trader client sentiment is a contrarian indicator as most of the retail traders are on average betting against the market trends. This is why, experienced traders tend to trade against the retail client sentiment. You can follow the TIOmarkets client sentiment live on our Forex dashboard.
The next key risk events impacting this market:
- USD - FOMC Member Waller Speaks
- USD - Unemployment Claims
- USD - Fed Chair Powell's Speech
- AUD - RBA Monetary Policy Statement
- USD - Prelim UoM Consumer Sentiment
- USD - Prelim UoM Inflation Expectations

Potential AUDUSD Market Moves
If the market creates a higher swing low above the 0.6270 and rallies above 0.6522, a move to 0.6617 could be likely. This would require the risk appetite in the markets to change and traders to favour risky assets instead of the dollar.
If the bullish Fed talk and the dollar strength continues we could see the AUDUSD pair moving to the 0.6270 low and then perhaps even below the level. As the down move in the AUDUSD seems to be USD driven continued USD strength would probably be needed to accommodate this.
How would you trade the AUDUSD today?
I hope this fundamental and technical AUDUSD analysis helps you to make better informed trading decisions. Check the latest market analysis for other instruments and subscribe to receive them in your inbox as soon as they are published
DISCLAIMER: TIO Markets offers an exclusively execution-only service. The views expressed are for information purposes only. None of the content provided constitutes any form of investment advice. The comments are made available purely for educational and marketing purposes and do NOT constitute advice or investment recommendation (and should not be considered as such) and do not in any way constitute an invitation to acquire any financial instrument or product. TIOmarkets and its affiliates and consultants are not liable for any damages that may be caused by individual comments or statements by TIOmarkets analysis and assumes no liability with respect to the completeness and correctness of the content presented. The investor is solely responsible for the risk of his/her investment decisions. The analyses and comments presented do not include any consideration of your personal investment objectives, financial circumstances, or needs. The content has not been prepared in accordance with any legal requirements for financial analysis and must, therefore, be viewed by the reader as marketing information. TIOmarkets prohibits duplication or publication without explicit approval.

Janne Muta holds an M.Sc in finance and has over 20 years experience in analysing and trading the financial markets.
Related Posts


Trade responsibly: CFDs are complex instruments and come with a high risk of losing all your invested capital due to leverage.