AUDUSD Technical Analysis | AUDUSD Weakens on RBA's Rate Hold
BY Janne Muta
|December 5, 2023AUDUSD Technical Analysis – The Reserve Bank of Australia (RBA) left rates untouched today at 4.35% and maintains a data-driven approach to its monetary policy, with a focus on returning inflation to its target. Despite some alignment of limited economic data with expectations, the RBA remains determined to achieve its inflation target.
Although the labour market is gradually easing, it still maintains tight conditions. The RBA emphasizes the need to assess the impact of recent interest rate hikes on demand, inflation, and the labour market, leaving room for further tightening if necessary.
Yesterday's data revealed a substantial decline in US factory orders by 3.6% in October, the most significant drop since April 2020. This decline, worse than expected, reflects challenges posed by high interest rates and inflation in the industrial sector.
Orders for transportation equipment, specifically nondefense aircraft and parts, plummeted by 14.7%. Despite these setbacks, there were modest increases in orders for fabricated metal products and computers/electronic products. This data illustrates the widespread impact of economic conditions, prompting expectations for policy responses.
Regarding market expectations, the current anticipation of Fed rate cuts in 2024 appears excessive, as it reflects extreme rate cut expectations of five cuts totalling 1.25%. The US dollar index (DXY) has shown signs of stabilization, exerting pressure on risky assets like stocks, commodities, and major dollar rivals.
Summary of This AUDUSD Technical Analysis Report:
- It seems likely that the market could soon test the market structure area between 0.6500 and 0.6522. This is a significant market structure area, having resisted price movements on several occasions since the end of August. Therefore, traders should closely monitor price action around this range.
- If AUDUSD can attract sufficient buying above the 20-period moving average (currently at 0.6460) to form a higher reactionary low, then a bullish breakout from the descending trend channel could occur. Alternatively, a drop to 0.6370 could be possible.
- AUDUSD technical analysis suggests that if the 0.6571 support level breaks, short-term traders might target the 0.6522 level. Conversely, if there is substantial demand around the 0.6571 level, we might witness a bounce towards approximately 0.6645.
Read the full AUDUSD technical analysis report below.
AUDUSD Technical Analysis
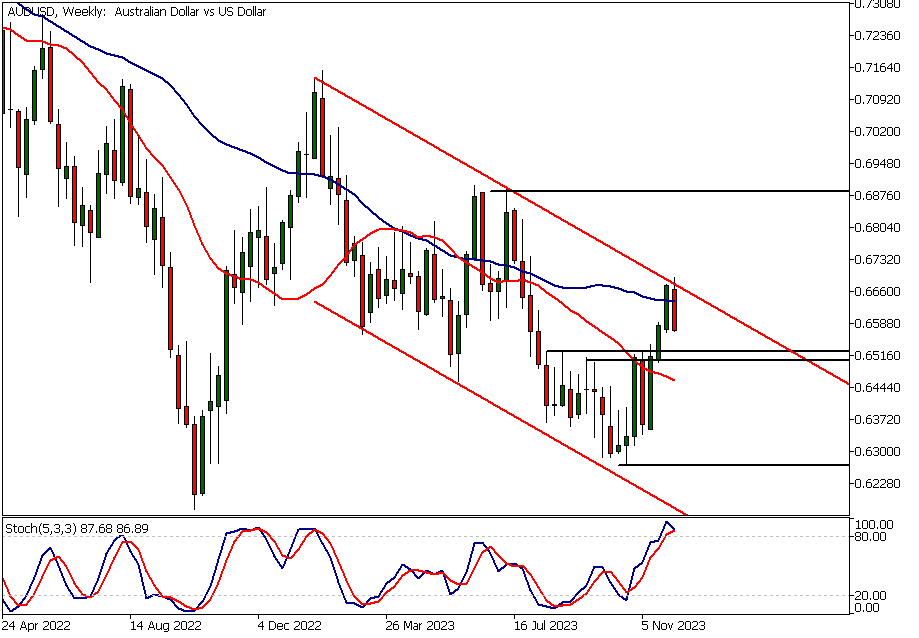
Weekly AUDUSD Technical Analysis
AUDUSD rallied to the high of the descending trend channel before declining this week. Today's downward movement was accelerated by the RBA's decision to keep interest rates steady at 4.35%. Note also that the USD Index has been strenghtening for three days and has, as a result, formed a bullish rejection candle in the weekly chart.
According to our AUDUSD technical analysis, the market remains in a weeekly downtrend, with the moving averages pointing lower and the fast moving average positioned below the slow one. Also noteworthy is the stochastic oscillator, which is in the overbought area and appears poised to issue a sell signal.
Key market structure area
It seems likely that the market could soon test the market structure area between 0.6500 and 0.6522. This is a significant market structure area, having resisted price movements on several occasions since the end of August. Therefore, traders should closely monitor price action around this range.
If AUDUSD can attract sufficient buying above the 20-period moving average (currently at 0.6460) to form a higher reactionary low, then a bullish breakout from the descending trend channel could occur. Alternatively, a drop to 0.6370 could be possible.
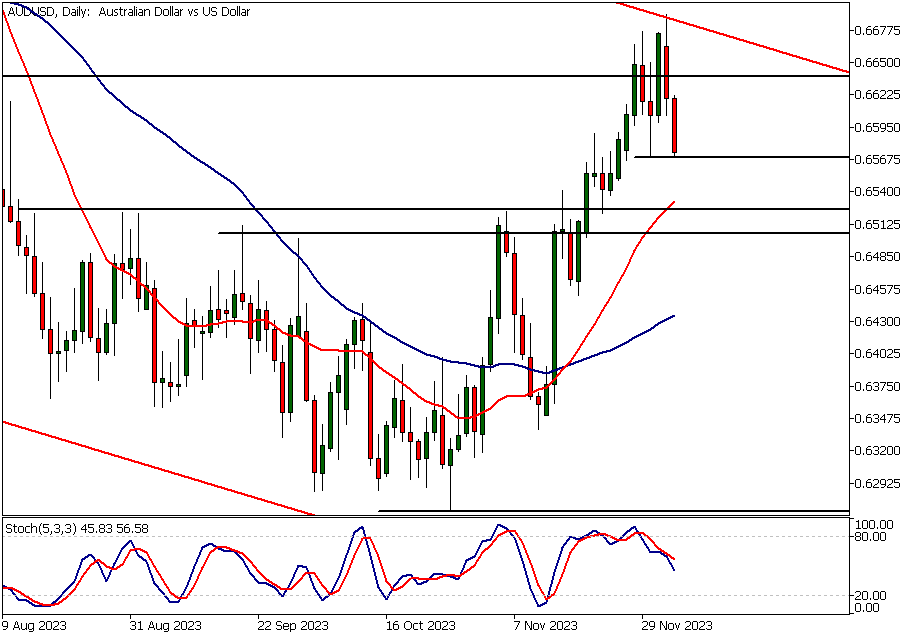
Daily AUDUSD Technical Analysis
The market has moved down to a daily support level at 0.6571. If this level fails to hold, a move to the weekly market structure level mentioned above could likely ensue. Given the downtrend observed on the weekly chart, the risk of lower timeframe support levels breaking remains relatively high.
Technical confluence
Note that the 20-period moving average coincides with the 0.6522 support level, thereby enhancing its technical significance. AUDUSD technical analysis suggests that if the 0.6571 support level breaks, short-term traders might target the 0.6522 level. Conversely, if there is substantial demand around the 0.6571 level, we might witness a bounce towards approximately 0.6645.

AUDUSD Technical Analysis, 8h
The technical outlook on the 8-hour chart closely mirrors the daily chart. The market has been trending higher in this timeframe (with both moving averages pointing upwards) and is currently trading at a key support level crucial for trend continuation.
Above this level, the 8-hour trend remains intact, but if the 0.6571 support level breaks, a trend reversal is confirmed, and we should anticipate a move down to the market structure area detailed in the weekly AUDUSD technical analysis section above.
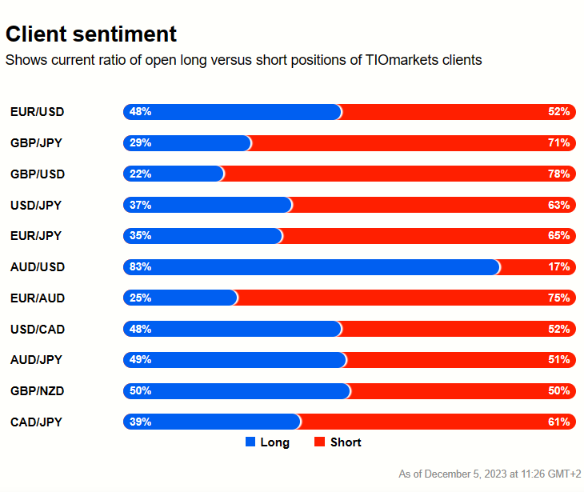
Client sentiment analysis
A majority of TIOmarkets' clients are bullish on AUDUSD with 83% holding long positions while only 17% hold short positions.
Please remember that the retail trader client sentiment is a contrarian indicator as most of the retail traders are on average betting against the market trends. This is why, experienced traders tend to trade against the retail client sentiment. You can follow the TIOmarkets client sentiment live on our Forex dashboard.
The next key risk events impacting this market:
- USD - ISM Services PMI
- USD - JOLTS Job Openings
- AUD - GDP
- USD - ADP Non-Farm Employment Change
- CHF - Foreign Currency Reserves
- USD - Unemployment Claims
- USD - Average Hourly Earnings
- USD - Non-Farm Employment Change
- USD - Unemployment Rate
- USD - Prelim UoM Consumer Sentiment
- USD - Prelim UoM Inflation Expectations
Potential AUDUSD Market Moves
If AUDUSD can attract sufficient buying above the 20-period moving average (currently at 0.6460) to form a higher reactionary low, then a bullish breakout from the descending trend channel could occur. Alternatively, a drop to 0.6370 could be possible.

How would you trade the AUDUSD today?
I hope this AUDUSD technical analysis helps you to make better informed trading decisions. Check the latest market analysis for other instruments and subscribe to receive them in your inbox as soon as they are published
DISCLAIMER: TIO Markets offers an exclusively execution-only service. The views expressed are for information purposes only. None of the content provided constitutes any form of investment advice. The comments are made available purely for educational and marketing purposes and do NOT constitute advice or investment recommendation (and should not be considered as such) and do not in any way constitute an invitation to acquire any financial instrument or product. TIOmarkets and its affiliates and consultants are not liable for any damages that may be caused by individual comments or statements by TIOmarkets analysis and assumes no liability with respect to the completeness and correctness of the content presented. The investor is solely responsible for the risk of his/her investment decisions. The analyses and comments presented do not include any consideration of your personal investment objectives, financial circumstances, or needs. The content has not been prepared in accordance with any legal requirements for financial analysis and must, therefore, be viewed by the reader as marketing information. TIOmarkets prohibits duplication or publication without explicit approval.

Janne Muta holds an M.Sc in finance and has over 20 years experience in analysing and trading the financial markets.
Related Posts


Trade responsibly: CFDs are complex instruments and come with a high risk of losing all your invested capital due to leverage.