AUDUSD Technical Analysis | Consolidation above a key support area
BY Janne Muta
|January 23, 2024AUDUSD Technical Analysis – Australia's NAB business confidence index improved to -1 in December 2023, up from -8 previously, marking a less negative trend in its third consecutive negative month. This improvement was largely due to gains in the mining and retail sectors.
Business conditions moderated yet remained above average, with sales, profits, and employment showing mixed results. Forward orders slightly increased, though capacity utilization declined. Notably, there was a significant slowdown in labour and purchase cost growth, and retail prices fell dramatically to 0.6%, the lowest since late 2020.
Summary of This AUDUSD Technical Analysis Report:
- Weekly momentum is down but the market trades above a key market structure area (0.6511 - 0.6524) that is closely aligned with the SMA 20. If the 0.6511 - 0.6524 range doesn't hold, the next key weekly support level can be found at 0.6338. Alternatively, if the market is successful in creating a higher reactionary low around the current price levels, then a move to 0.6750 could be eventually likely.
- The market traded higher from the 0.6511 - 0.6524 area creating a bullish rejection candle (a long-wicked candle with a close above open) but the rally has since then lost steam. The long wicks to the upside yesterday and today indicate weakness and could lead to the market re-testing the 0.6524 level and perhaps deeper to the support area mentioned above.
- The 2h chart shows the market moving sideways between 0.6566 and 0.6613. If the range is resolved to the downside the measured move target at 0.6515 could become relevant. Alternatively, above the range high the market could move to the 0.6660 measured move target.
Read the full AUDUSD technical analysis report below.
AUDUSD Technical Analysis
Weekly AUDUSD Technical Analysis
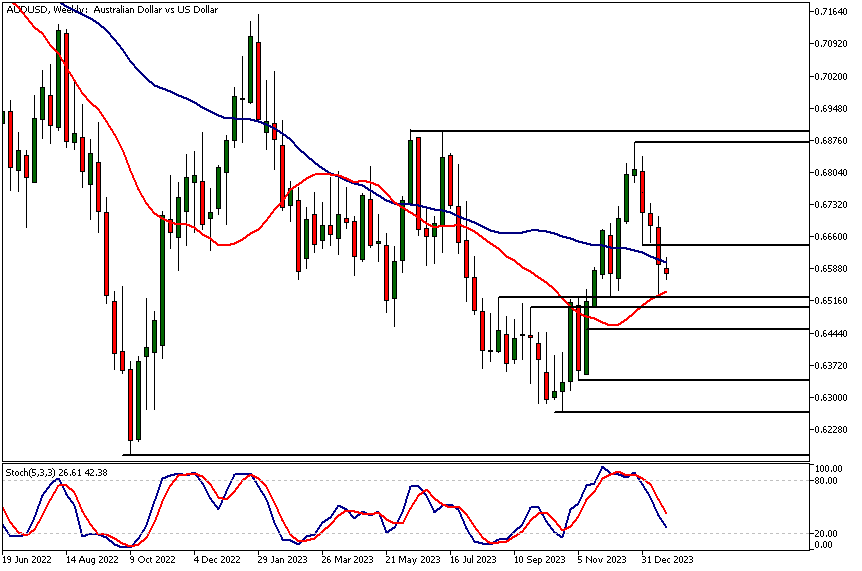
Weekly momentum is down but the market trades above a key market structure area (0.6511 - 0.6524) that is closely aligned with the SMA 20. This paused the decline last week but the relative closeness of the 0.6640 resistance has kept the price from advancing significantly.
Moving averages-based AUDUSD technical analysis suggests the market is still in a downtrend but since the market created a higher reactionary low in October it seems like AUDUSD could be building a sideways range between the October low (0.6270) and the December high (0.6871).
If the 0.6511 - 0.6524 range doesn't hold, the next key weekly support level can be found at 0.6338. Alternatively, if the market is successful in creating a higher reactionary low around the current price levels, then a move to 0.6750 could be eventually likely.
Daily AUDUSD Technical Analysis
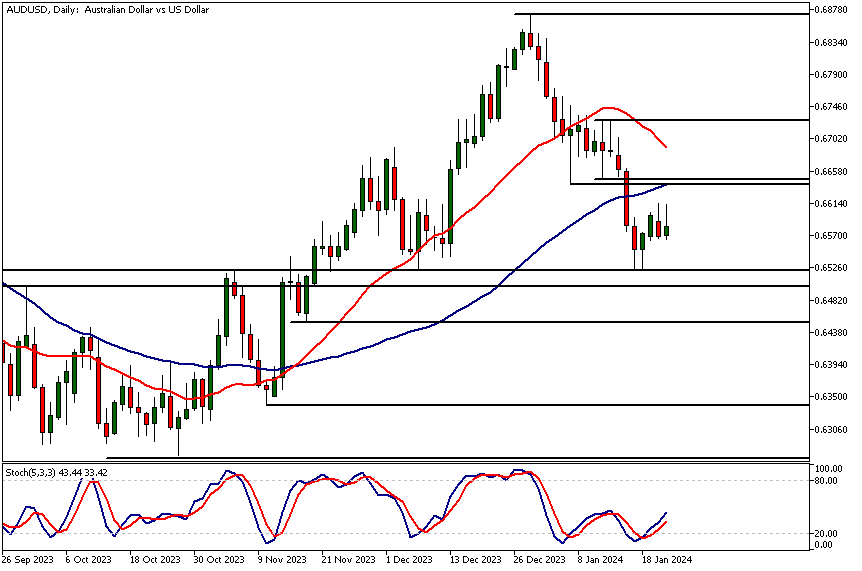
The market traded higher from the 0.6511 - 0.6524 area creating a bullish rejection candle (a long-wicked candle with a close above open) but the rally has since then lost steam. The long wicks to the upside yesterday and today indicate weakness and could lead to the market re-testing the 0.6524 level and perhaps deeper to the support area mentioned above.
AUDUSD technical analysis suggests that above the 0.6640 resistance, the market could trade to 0.6700 and then perhaps to 0.6750.
Intraday AUDUSD Technical Analysis
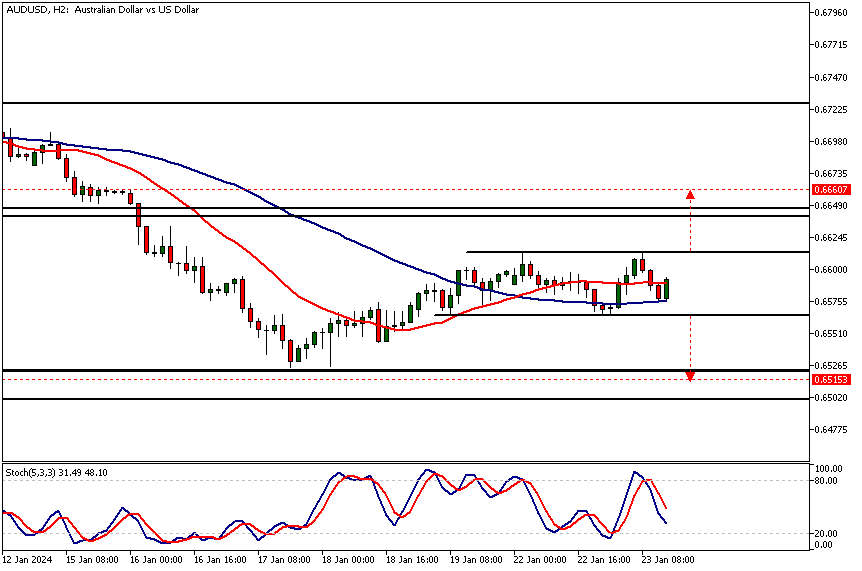
The 2h chart shows the market moving sideways between 0.6566 and 0.6613. If the range is resolved to the downside the measured move target at 0.6515 could become relevant. Alternatively, above the range high the market could move to the 0.6660 measured move target. At the same time, the fast SMA 20 has crossed above the slower SMA 50 indicating a potential trend reversal.
Client sentiment analysis
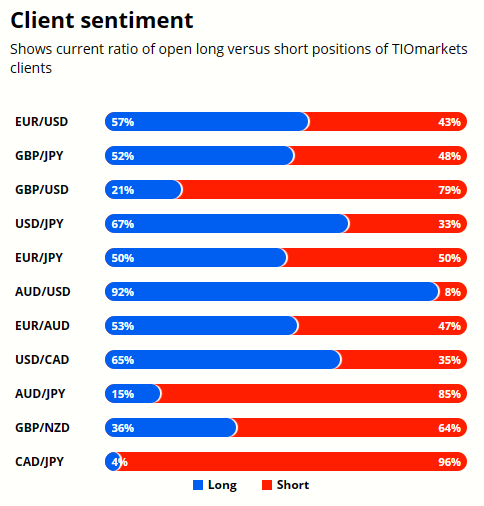
92% of clients trading AUDUSD are holding long positions, while 26% are holding short positions. Client sentiment data is being provided by TIO Markets Ltd.
Please note that retail client trading sentiment is often said to be a contrarian indicator. This is because trade data suggests that private (non-professional) traders, on average, trade against market price trends. You can follow the TIOmarkets client sentiment live on our Forex dashboard.
The next key risk events impacting this market:
- USD - Flash Manufacturing PMI
- USD - Flash Services PMI
- USD - Advance GDP q/q
- USD - Unemployment Claims
- USD - Advance GDP Price Index q/q
- USD - Core Durable Goods Orders m/m
- USD - Durable Goods Orders m/m
- USD - New Home Sales
- USD - Core PCE Price Index m/m
- USD - Pending Home Sales m/m
Potential AUDUSD Market Moves
Weekly momentum is down but the market trades above a key market structure area (0.6511 - 0.6524) that is closely aligned with the SMA 20. If the 0.6511 - 0.6524 range doesn't hold, the next key weekly support level can be found at 0.6338. Alternatively, if the market is successful in creating a higher reactionary low around the current price levels, then a move to 0.6750 could be eventually likely.

How Would You Trade AUDUSD Today?
I hope this AUDUSD technical analysis helps you to make better informed trading decisions. Check the latest market analysis for other instruments and subscribe to receive them in your inbox as soon as they are published
DISCLAIMER: TIO Markets offers an exclusively execution-only service. The views expressed are for information purposes only. None of the content provided constitutes any form of investment advice. The comments are made available purely for educational and marketing purposes and do NOT constitute advice or investment recommendation (and should not be considered as such) and do not in any way constitute an invitation to acquire any financial instrument or product. TIOmarkets and its affiliates and consultants are not liable for any damages that may be caused by individual comments or statements by TIOmarkets analysis and assumes no liability with respect to the completeness and correctness of the content presented. The investor is solely responsible for the risk of his/her investment decisions. The analyses and comments presented do not include any consideration of your personal investment objectives, financial circumstances, or needs. The content has not been prepared in accordance with any legal requirements for financial analysis and must, therefore, be viewed by the reader as marketing information. TIOmarkets prohibits duplication or publication without explicit approval.

Janne Muta holds an M.Sc in finance and has over 20 years experience in analysing and trading the financial markets.
Related Posts


Trade responsibly: CFDs are complex instruments and come with a high risk of losing all your invested capital due to leverage.