AUDUSD Technical Analysis | Rally loses steam at weekly resistance level
BY Janne Muta
|November 16, 2023AUDUSD Technical Analysis – The AUDUSD formed a bearish exhaustion candle yesterday before trading lower today. The weakness came despite Australia's significant job growth of 55K, surpassing expectations.
Both currencies are facing inflationary pressures, though the US economy is showing signs of easing inflation. Consumer spending remains robust in both economies, despite weakening consumer sentiment.
Central bank policies are focused on inflation control, with the RBA being more aggressive in its recent rate hike and the Fed expected to cut the rates next year. Overall, the economic outlook for both economies is cautiously optimistic, with key challenges including managing inflation, maintaining consumer spending, and navigating uncertain global economic conditions.
Summary of This AUDUSD Technical Analysis Report:
- The AUDUSD is in a bearish trend in the weekly timeframe chart and currently trading below a major resistance level (0.6522).
- The bearish exhaustion candle created yesterday indicated weakness that followed today (despite the strong employment data). If the weakness continues a move down to 0.6400 level could be likely where the proximity of a higher swing low at 0.6385 could attract buyers.
- The 4h chart reveals two support levels with the nearest at 0.6461 bouncing the market higher after a decline that followed the jobs data. The shooting star candle in the daily chart indicates though that the market could be weak and might break below this support level. If it does then the next support level at 0.6391 could come into play.
Read the full AUDUSD technical analysis report below.
AUDUSD Technical Analysis
Weekly AUDUSD Technical Analysis
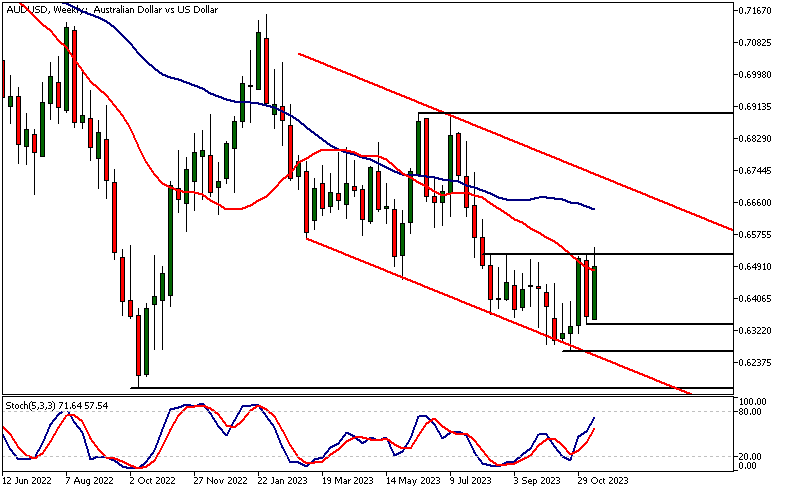
The AUDUSD is in a bearish trend in the weekly timeframe chart and currently trading below a major resistance level (0.6522). The moving averages are pointing lower with the SMA(20) below the slower SMA(50). Those applying indicator based AUDUSD technical analysis should also monitor the Stochastic oscillator which is getting near the oversold area.
While the long term bias is bearish the market has been consolidating relatively near to the 2022 low. If the Australian jobs market remains strong and inflation elevated the strongest downside pressure in AUDUSD could be over. Assuming of course that the Fed rate cut expectations for the next year remain strong.
Key threshold level
If the market breaks above the 0.6522 and succeeds in maintaining those levels we could eventually see the market trading to 0.6700. Below the 0.6522 level a move down to 0.6270 could be likely.
Daily AUDUSD Technical Analysis
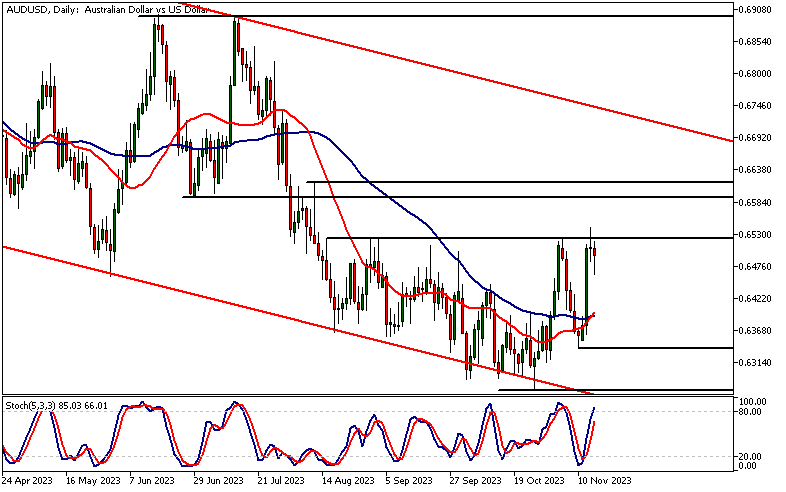
The bearish exhaustion candle created yesterday indicated weakness that followed today (despite the strong employment data). If the weakness continues a move down to 0.6400 level could be likely where the proximity of a higher swing low at 0.6385 could attract buyers.
In fact, the higher swing low and the strong up move that followed suggests the market might not be as bearish as it was before the October low (0.6270) was established.
Potential targets
Our AUDUSD technical analysis suggests that if the market can either create a higher swing low above 0.6385 and/or push above the weekly resistance level at 0.6522 the bulls could take the market to 0.6600 or so.
Indicator based AUDUSD technical analysis shows the SMA(20) could be crossing above the SMA(50) after converging for some time. At the same time the Stochastic oscillator is in the overbought area suggesting short-term weakness.
AUDUSD Technical Analysis, 8h
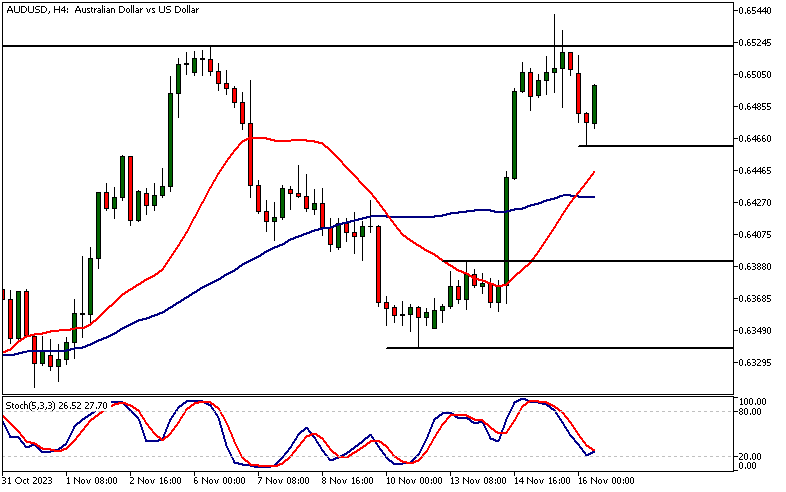
The 4h chart reveals two support levels with the nearest at 0.6461 bouncing the market higher after a decline that followed the jobs data. The shooting star candle in the daily chart indicates though that the market could be weak and might break below this support level. If it does then the next support level at 0.6391 could come into play. Alternatively, AUDUSD technical analysis suggests that above the 0.6461 level a retest of today’s high at 0.6541 could be retested.
Client sentiment analysis
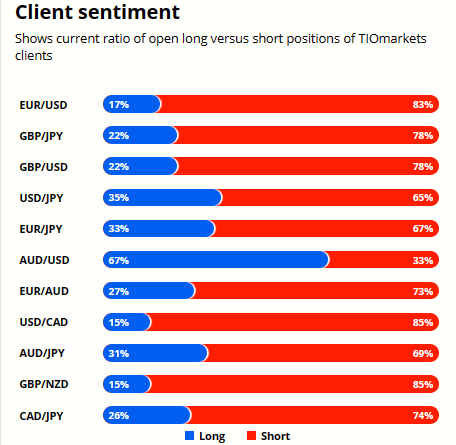
A majority of TIOmarkets' clients are optimistic about the market as 67% hold long positions while only 33% are pessimistic and hold short positions.
Please remember that the retail trader client sentiment is a contrarian indicator as most of the retail traders are on average betting against the market trends. This is why, experienced traders tend to trade against the retail client sentiment. You can follow the TIOmarkets client sentiment live on our Forex dashboard.
The next key risk events impacting this market:
- USD - Unemployment Claims
- USD - Philly Fed Manufacturing Index
- USD - Industrial Production m/m
- USD - Building Permits
- AUD - RBA Gov Bullock Speaks
- AUD - Monetary Policy Meeting Minutes
- USD - Existing Home Sales
- USD - FOMC Meeting Minutes
Potential AUDUSD Market Moves
Our AUDUSD technical analysis suggests that if the market can either create a higher swing low above 0.6385 and/or push above the weekly resistance level at 0.6522 the bulls could take the market to 0.6600 or so. Alternatively, below 0.6522 look for a move to 0.6400.
How would you trade the AUDUSD today?
I hope this AUDUSD technical analysis helps you to make better informed trading decisions. Check the latest market analysis for other instruments and subscribe to receive them in your inbox as soon as they are published
DISCLAIMER: TIO Markets offers an exclusively execution-only service. The views expressed are for information purposes only. None of the content provided constitutes any form of investment advice. The comments are made available purely for educational and marketing purposes and do NOT constitute advice or investment recommendation (and should not be considered as such) and do not in any way constitute an invitation to acquire any financial instrument or product. TIOmarkets and its affiliates and consultants are not liable for any damages that may be caused by individual comments or statements by TIOmarkets analysis and assumes no liability with respect to the completeness and correctness of the content presented. The investor is solely responsible for the risk of his/her investment decisions. The analyses and comments presented do not include any consideration of your personal investment objectives, financial circumstances, or needs. The content has not been prepared in accordance with any legal requirements for financial analysis and must, therefore, be viewed by the reader as marketing information. TIOmarkets prohibits duplication or publication without explicit approval.

Janne Muta holds an M.Sc in finance and has over 20 years experience in analysing and trading the financial markets.
Related Posts


Trade responsibly: CFDs are complex instruments and come with a high risk of losing all your invested capital due to leverage.