AUDUSD Technical Analysis | RBA indicates that more rate hikes are needed
BY Janne Muta
|November 22, 2023AUDUSD Technical Analysis – AUDUSD has risen at the back of RBA promising rate hikes and lower US yields that have pressured the dollar. Yields have moved lower as investors have been buying bonds in response to increased speculation that the Fed would not raise rates anymore but instead would be likely to cut rates four times next year.
November FOMC minutes show a cautious Fed stance, noting a slightly eased but tight labor market and moderated inflation. The consensus is for a restrictive policy until inflation aligns with goals, amid economic uncertainty.
The RBA raised its rate to 4.35%, first in five months. Minutes suggest inflation may hit targets by late 2025 with one or two more hikes. RBA attributes Australian inflation to demand factors, hinting further hikes depend on inflation and demand surprises.
The upcoming data suggests the Fed is remain in monitoring mode. US unemployment claims, expected at 226K (down from 231K), hint at a stable job market. A significant drop in durable goods orders, expected at -3.2% (from +4.6%), may boost expectations for Fed rate cuts.
Modest rises in consumer sentiment (61.1 expected, 60.4 previous) and steady Manufacturing and Services PMI (49.9 and 50.4 expected) indicate slight economic growth. These data points suggest the Fed might favour a cautious, 'wait and see' approach.
Summary of This AUDUSD Technical Analysis Report:
- The AUDUSD currency pair has rallied to the neckline of a double top formation created in June and July. The neckline at 0.6595 proved to be a significant resistance for the AUD bulls, and at the time of writing, the market has corrected slightly lower.
- The daily chart shows the market trading between the 0.6511 market structure level and the neckline at 0.6595. In yesterday's trading, the market formed a bearish rejection candle, with the high almost at the neckline mentioned in the weekly AUDUSD technical analysis section.
Read the full AUDUSD technical analysis report below.
AUDUSD Technical Analysis
Weekly AUDUSD Technical Analysis
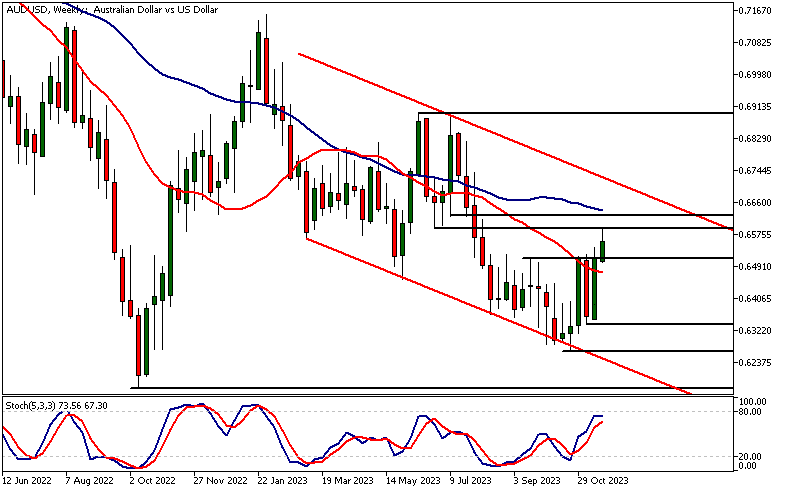
The AUDUSD currency pair has rallied to the neckline of a double top formation created in June and July. The neckline at 0.6595 proved to be a significant resistance for the AUD bulls, and at the time of writing, the market has corrected slightly lower.
Weekly downtrend
Despite recent USD weakness lifting the AUDUSD pair, the market remains in a downtrend in the weekly timeframe. If the bulls manage to push the market higher, the next test for their commitment will be a market structure level at 0.6623, closely aligned with the 50-period moving average. The nearest market structure level that could support the AUDUSD is also fairly close, at 0.6511.
Indicator-based AUD technical analysis paints a bearish picture, with the 20-period moving average below the 50-period SMA and the stochastic oscillator nearing the overbought threshold of 80.
Daily AUDUSD Technical Analysis
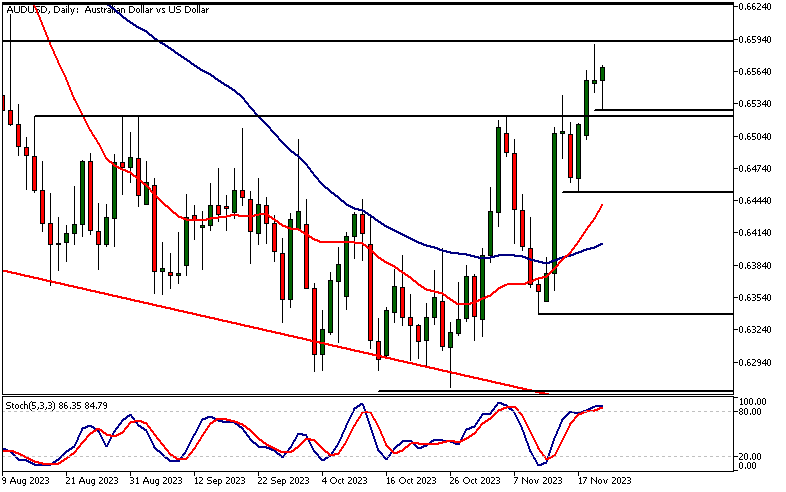
The daily chart shows the market trading between the 0.6511 market structure level and the neckline at 0.6595. In yesterday's trading, the market formed a bearish rejection candle, with the high almost at the neckline mentioned in the weekly AUDUSD technical analysis section.
Potential target price levels
Should the market move decisively below the 0.6511 support level, we could see it descending to 0.6460. Alternatively, if the bulls defend levels above 0.6511 and can push the market above yesterday's high (0.6589), the market could advance to 0.6620.
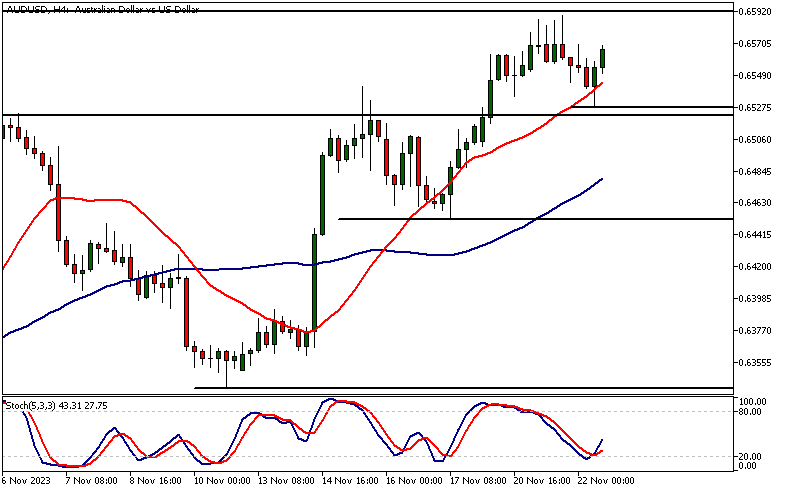
AUDUSD Technical Analysis, 4h
In the 4-hour chart, the market has attracted buying slightly above the 0.6511 market structure level, creating a higher swing low at 0.6527. Above this level, look for a move to 0.6580, while below it, the market could descend to 0.6460.
In this timeframe, indicator-based AUDUSD technical analysis suggests that the market is bullish, with the 20-period moving average moving above the 50-period SMA and both averages pointing higher. Simultaneously, the stochastic oscillator has given a buy signal as the stochastic line has moved above the signal line.
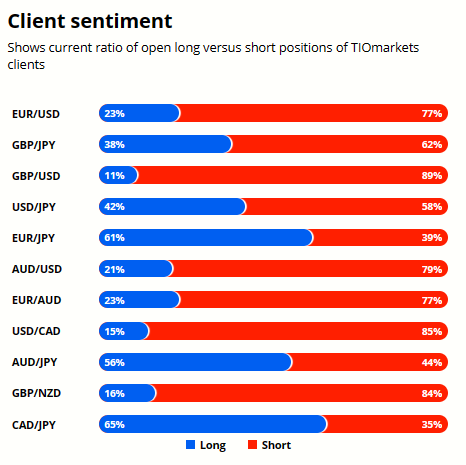
Client sentiment analysis
A majority of TIOmarkets' clients are bearish on AUDUSD with 79% holding short positions while only 21% are optimistic and hold long positions.
Please remember that the retail trader client sentiment is a contrarian indicator as most of the retail traders are on average betting against the market trends. This is why, experienced traders tend to trade against the retail client sentiment. You can follow the TIOmarkets client sentiment live on our Forex dashboard.
The next key risk events impacting this market:
- USD - Unemployment Claims
- USD - Core Durable Goods Orders m/m
- USD - Durable Goods Orders
- USD - Revised UoM Consumer Sentiment
- USD - Flash Manufacturing PMI
- USD - Flash Services PMI
Potential AUDUSD Market Moves
Should the market move decisively below the 0.6511 support level, we could see it descending to 0.6460. Alternatively, if the bulls defend levels above 0.6511 and can push the market above yesterday's high (0.6589), the market could advance to 0.6620.

How would you trade the AUDUSD today?
I hope this AUDUSD technical analysis helps you to make better informed trading decisions. Check the latest market analysis for other instruments and subscribe to receive them in your inbox as soon as they are published
DISCLAIMER: TIO Markets offers an exclusively execution-only service. The views expressed are for information purposes only. None of the content provided constitutes any form of investment advice. The comments are made available purely for educational and marketing purposes and do NOT constitute advice or investment recommendation (and should not be considered as such) and do not in any way constitute an invitation to acquire any financial instrument or product. TIOmarkets and its affiliates and consultants are not liable for any damages that may be caused by individual comments or statements by TIOmarkets analysis and assumes no liability with respect to the completeness and correctness of the content presented. The investor is solely responsible for the risk of his/her investment decisions. The analyses and comments presented do not include any consideration of your personal investment objectives, financial circumstances, or needs. The content has not been prepared in accordance with any legal requirements for financial analysis and must, therefore, be viewed by the reader as marketing information. TIOmarkets prohibits duplication or publication without explicit approval.

Janne Muta holds an M.Sc in finance and has over 20 years experience in analysing and trading the financial markets.
Related Posts


Trade responsibly: CFDs are complex instruments and come with a high risk of losing all your invested capital due to leverage.