AUDUSD Technical Analysis | Traders wait for employment figures
BY Janne Muta
|January 17, 2024AUDUSD Technical Analysis – The dollar strengthened sending AUDUSD lower by almost 1.5%, a significant down move that took the currency pair to key technical levels. USD rallied further as markets have started questioning central banks' willingness to reduce interest rates.
Yesterday Federal Reserve Governor Christopher Waller emphasized the need for sustained low inflation before considering rate cuts. Also, renewed concerns over Red Sea attacks have increased fears about supply chain disruptions and geopolitical tensions, boosting the dollar to a one-month high.
Today's Australian consumer sentiment data reveals a dip, with the Westpac-Melbourne Institute Consumer Sentiment index in Australia declining by 1.3% to a level of 81 in January 2024. This decrease follows a rise of 2.7% the previous month.
US retail sales in December 2023 experienced a robust 0.6% month-over-month increase, surpassing expectations. This has potential to increase inflation expectations and might therefore pressure AUDUSD:
Tomorrow the Australian Bureau of Statistics (ABS) reports employment data for December. In November, the number of jobs surged with an addition of 61.5K jobs, a figure that comfortably exceeded the forecasts and the 42.7K jobs added in October. The data indicates a thriving job market and suggests economic resilience.
Analysts are awaiting December's figures, with a conservative estimate of 17.6K jobs. Should the actual data align with or exceed expectations, it could imply a continuation of the positive trend, potentially supporting the AUD. On the flip side, any shortfall might dampen AUD sentiment.
Summary of This AUDUSD Technical Analysis Report:
- The AUDUSD pair is trading at a pivotal support area (0.6511 - 0.6524), closely aligned with the 20-period moving average. The 50-period moving average continues to point lower, and the 20-period SMA remains below the 50-period SMA, indicating a long-term downtrend. The nearest key resistance level aligns closely with last week's low at 0.6640.
- If the market attracts buyers above the 0.6511 - 0.6524 zone, we could see a move to the key resistance level at 0.6640. Alternatively, if the market decisively breaks below the support area, anticipate a potential decline to around 0.6460.
Read the full AUDUSD technical analysis report below.
AUDUSD Technical Analysis
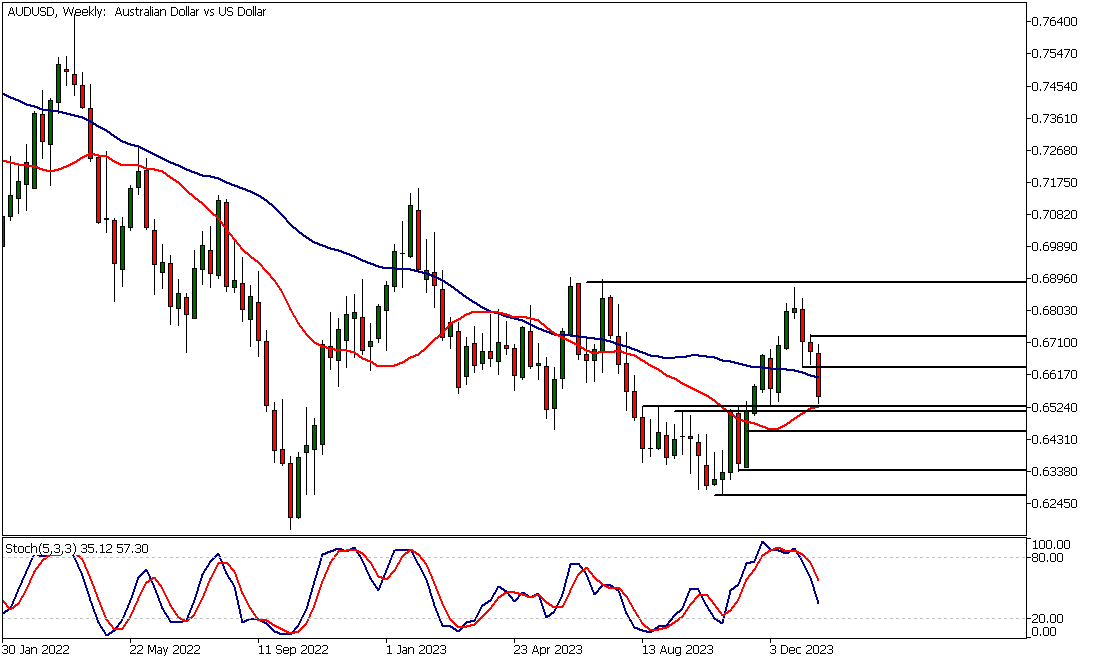
Weekly AUDUSD Technical Analysis
The weekly chart reveals the AUDUSD trading at a pivotal support area (0.6511 - 0.6524), closely aligned with the 20-period moving average. The 50-period moving average continues to point lower, and the 20-period SMA remains below the 50-period SMA, indicating a long-term downtrend. The nearest key resistance level aligns closely with last week's low at 0.6640.
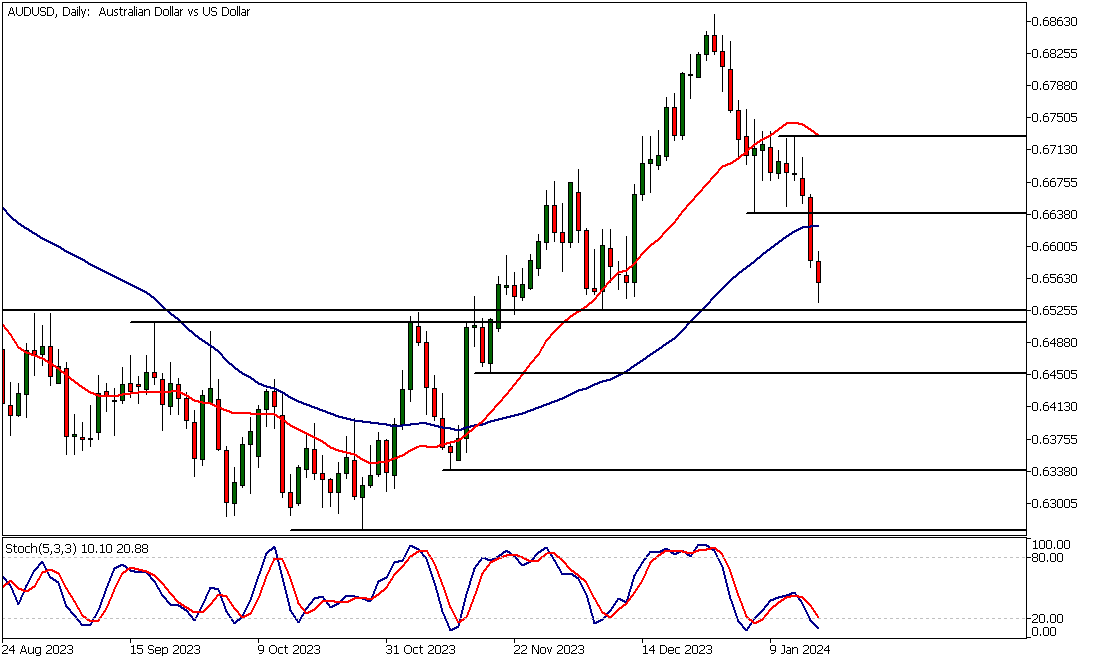
Daily AUDUSD Technical Analysis
The market has descended to pivotal levels that previously acted as resistance in September and October, before turning into support in November and December last year. This shift led to an over 5% rally in AUDUSD, highlighting the 0.6511 - 0.6524 range as a psychologically significant area.
If the market attracts buyers above this level, we could see a move to the key resistance level at 0.6640. Alternatively, if the market decisively breaks below the support area, anticipate a potential decline to around 0.6460.
Mixed signals from indicators
Mixed signals emerge from moving averages-based AUDUSD technical analysis, as yesterday's rapid decline affected their trajectory. Therefore, despite trading substantially below the 50-period SMA, the moving averages still point higher. The stochastic oscillator is oversold, following the market's swift downturn yesterday.
Traders should closely monitor tomorrow's price action following the release of the employment numbers.
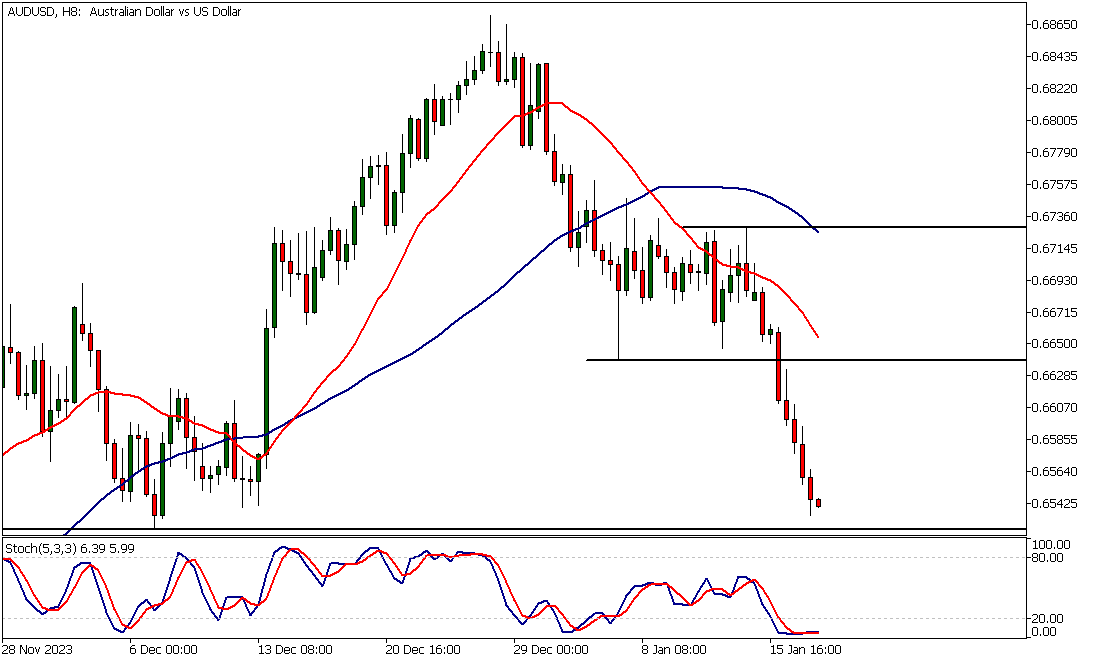
Intraday AUDUSD Technical Analysis
After the market broke below the key support level at 0.6640, it fell by almost 1.5%, reaching oversold conditions on the 8-hour chart. AUDUSD technical analysis, oriented towards moving averages, continues to indicate a downtrend as the 20-period moving average has crossed below the 50-period moving average.
However, with the market trading near key support levels, the immediate downside risk may be limited. The nearest key support level stands at 0.6525.
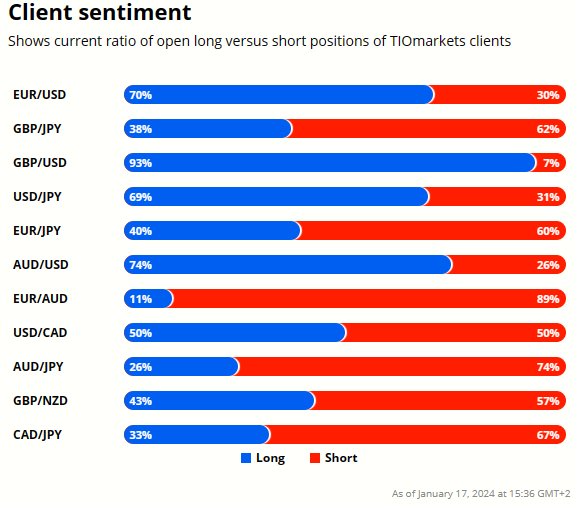
Client sentiment analysis
74% of clients trading AUDUSD are holding long positions, while 26% are holding short positions. Client sentiment data is being provided by TIO Markets Ltd.
Please note that retail client trading sentiment is generally a contrarian indicator, as private (non professional) traders, on average, trade against market price trends. You can follow the TIOmarkets client sentiment live on our Forex dashboard.
The next key risk events impacting this market:
- USD - Core Retail Sales m/m
- USD - Retail Sales m/m
- USD - Industrial Production m/m
- AUD - Employment Change
- AUD - Unemployment Rate
- USD - Unemployment Claims
- USD - Building Permits
- USD - Philly Fed Manufacturing Index
- USD - Prelim UoM Consumer Sentiment
- USD - Existing Home Sales
- USD - Prelim UoM Inflation Expectations
Potential AUDUSD Market Moves
If AUDUSD breaks above 0.6748 – 0.6760 range, a rise to 0.6850 could be If the market attracts buyers above the 0.6511 - 0.6524 zone, we could see a move to the key resistance level at 0.6640. Alternatively, if the market decisively breaks below the support area, anticipate a potential decline to around 0.6460.

How Would You Trade AUDUSD Today?
I hope this AUDUSD technical analysis helps you to make better informed trading decisions. Check the latest market analysis for other instruments and subscribe to receive them in your inbox as soon as they are published
DISCLAIMER: TIO Markets offers an exclusively execution-only service. The views expressed are for information purposes only. None of the content provided constitutes any form of investment advice. The comments are made available purely for educational and marketing purposes and do NOT constitute advice or investment recommendation (and should not be considered as such) and do not in any way constitute an invitation to acquire any financial instrument or product. TIOmarkets and its affiliates and consultants are not liable for any damages that may be caused by individual comments or statements by TIOmarkets analysis and assumes no liability with respect to the completeness and correctness of the content presented. The investor is solely responsible for the risk of his/her investment decisions. The analyses and comments presented do not include any consideration of your personal investment objectives, financial circumstances, or needs. The content has not been prepared in accordance with any legal requirements for financial analysis and must, therefore, be viewed by the reader as marketing information. TIOmarkets prohibits duplication or publication without explicit approval.

Janne Muta holds an M.Sc in finance and has over 20 years experience in analysing and trading the financial markets.
Related Posts


Trade responsibly: CFDs are complex instruments and come with a high risk of losing all your invested capital due to leverage.