EURUSD Technical Analysis | Bearish trendline break
BY Janne Muta
|January 18, 2024EURUSD Technical Analysis - Christine Lagarde, head of the European Central Bank (ECB), indicated potential shifts in interest rate policy in Davos. Emphasizing caution, she indicated that despite a possible peak in rates, high interest rates might remain due to uneven inflation declines. This suggests a gradual approach to rate cuts, aiming to balance inflation control with monetary policy easing.
ECB policymakers are aligning on interest rates, with decisions hinging on economic data. The bank is monitoring wage-induced inflation risks and is considering a rate cut by June, based on forthcoming data.
Market response has adjusted expectations of ECB rate cuts this year. Predictions have shifted from six to five quarter-point reductions, with a 60% chance of a sixth, mirroring the ECB's data-dependent stance and need for clear inflation control.
Summary of This EURUSD Technical Analysis Report:
- EURUSD technical analysis paints a short-term bearish picture as the pair broke below a medium-term trendline, indicating weakness. The next key weekly support levels are at 1.0723 and 1.0756. These levels are relatively close to the SMA(20), so, together with the SMA, they create a technical confluence zone that could be targeted by EUR bears.
- Tuesday's downward move broke the market below a medium-term uptrend, and the trendline now creates an upward-sloping resistance closely aligned with the 1.0923 resistance level. Note also that the bearish trend channel's top coincides with them. Therefore, EURUSD technical analysis indicates further downside below the 1.0923 level.
- The market trading lower inside a bearish trend channel, our EURUSD technical analysis indicates short-term bearishness that could lead to the market trading down to around 1.0818, especially if the 1.0923 resistance level holds.
Read the full EURUSD technical analysis report below.
EURUSD Technical Analysis
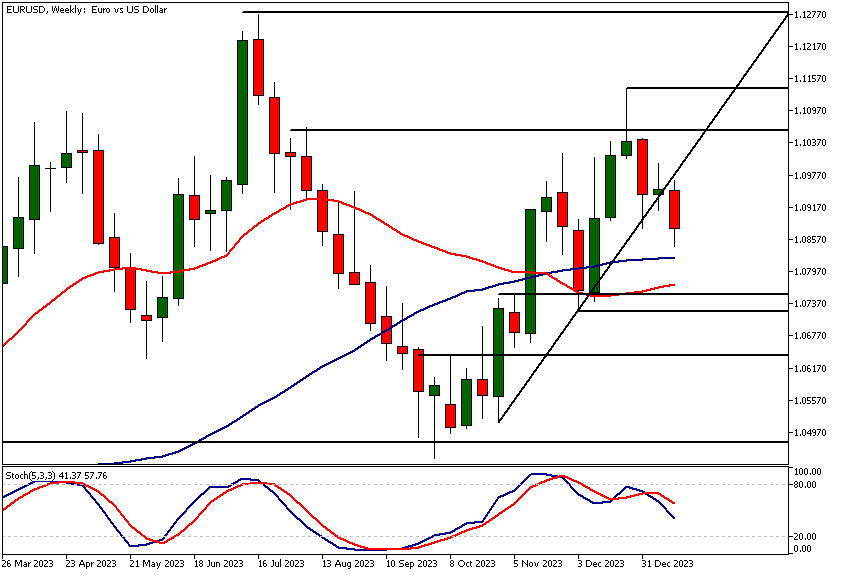
Weekly EURUSD Technical Analysis
EURUSD technical analysis paints a short-term bearish picture as the pair broke below a medium-term trendline, indicating weakness. The next key weekly support levels are at 1.0723 and 1.0756.
These levels are relatively close to the SMA(20), so, together with the SMA, they create a technical confluence zone that could be targeted by EUR bears. The SMA(50), pointing higher, suggests some long-term upward bias in the market, but the stochastic oscillator suggests a loss of upside momentum, with the Stochastic line below the signal line.
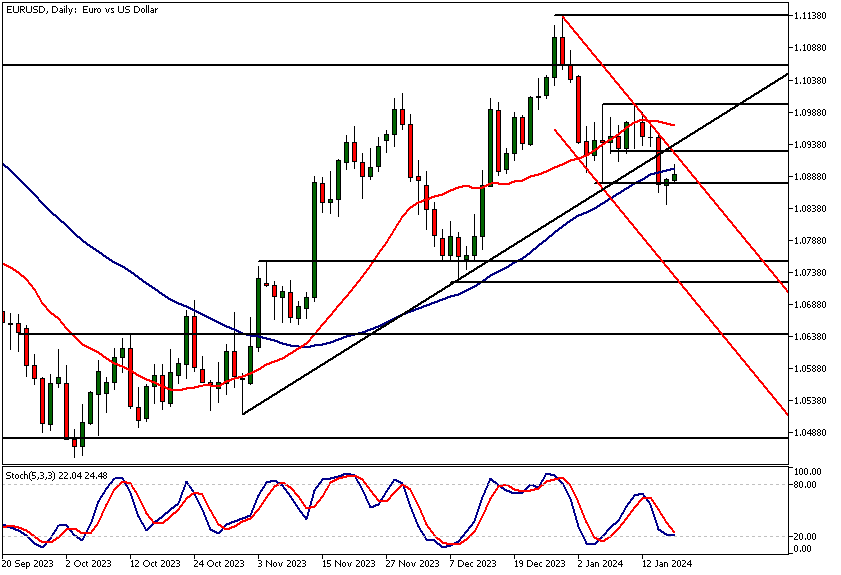
Daily EURUSD Technical Analysis
EURUSD broke out of a tight price range the day before yesterday. This move took the market to a support level at 1.0877, and yesterday the market created a bullish rejection candle, with a daily close above this level. The indication is that the bulls might want to try and push the market higher.
However, Tuesday's downward move broke the market below a medium-term uptrend, and the trendline now creates an upward-sloping resistance closely aligned with the 1.0923 resistance level. Note also that the bearish trend channel's top coincides with them.
Therefore, EURUSD technical analysis indicates further downside below the 1.0923 level, and we could see the market trading down to 1.0818. Alternatively, should there be a decisive rally above this pivotal resistance at 1.0923, a move up to 1.0990 could be likely.
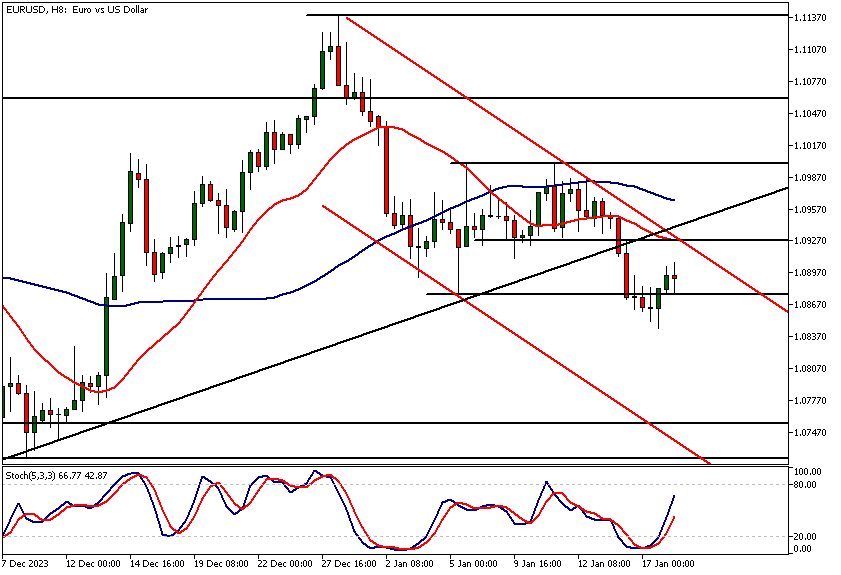
Intraday EURUSD Technical Analysis
The 8-hour chart shows the market creating lower lows, and now both moving averages point lower, with the SMA(20) below the SMA(50). The stochastic oscillator is currently pointing higher, indicating a contra-trend move in the market.
With these indications, and the market trading lower inside a bearish trend channel, our EURUSD technical analysis indicates short-term bearishness that could lead to the market trading down to around 1.0818, especially if the 1.0923 resistance level holds.
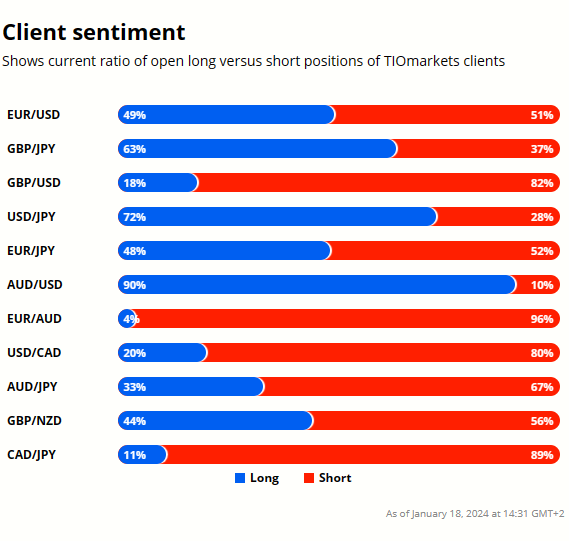
Client sentiment analysis
49% of clients trading EURUSD are holding long positions, while 51% are holding short positions. Client sentiment data is being provided by TIO Markets Ltd.
Please note that retail client trading sentiment is generally a contrarian indicator, as private (non professional) traders, on average, trade against market price trends. You can follow the TIOmarkets client sentiment live on our Forex dashboard.
The next key risk events impacting this market
- USD - Unemployment Claims
- USD - Building Permits
- USD - Philly Fed Manufacturing Index
- EUR - ECB President Lagarde Speaks
- EUR - ECB President Lagarde Speaks
- USD - Prelim UoM Consumer Sentiment
- USD - Existing Home Sales
- USD - Prelim UoM Inflation Expectations
Potential EURUSD Market Moves
EURUSD technical analysis indicates further downside below the 1.0923 level, and we could see the market trading down to 1.0818. Alternatively, should there be a decisive rally above this pivotal resistance at 1.0923, a move up to 1.0990 could be likely.

How Would You Trade EURUSD Today?
I hope this EURUSD technical analysis report helps you to make better informed trading decisions. Check the latest market analysis for other instruments and subscribe to receive them in your inbox as soon as they are published
DISCLAIMER: TIO Markets offers an exclusively execution-only service. The views expressed are for information purposes only. None of the content provided constitutes any form of investment advice. The comments are made available purely for educational and marketing purposes and do NOT constitute advice or investment recommendation (and should not be considered as such) and do not in any way constitute an invitation to acquire any financial instrument or product. TIOmarkets and its affiliates and consultants are not liable for any damages that may be caused by individual comments or statements by TIOmarkets analysis and assumes no liability with respect to the completeness and correctness of the content presented. The investor is solely responsible for the risk of his/her investment decisions. The analyses and comments presented do not include any consideration of your personal investment objectives, financial circumstances, or needs. The content has not been prepared in accordance with any legal requirements for financial analysis and must, therefore, be viewed by the reader as marketing information. TIOmarkets prohibits duplication or publication without explicit approval.

Janne Muta holds an M.Sc in finance and has over 20 years experience in analysing and trading the financial markets.
Related Posts


Trade responsibly: CFDs are complex instruments and come with a high risk of losing all your invested capital due to leverage.