


Swing Trading Indicators: Types, Complete List and Combinations to Apply
BY Maria K.
|July 29, 2026Swing trading indicators are technical analysis tools that process historical price, volume, or momentum data, to generate analytical signals used in the evaluation of possible entry and exit points for trading. Swing trading relies on timing entries and exits within short-to-medium-term price movements, so traders could struggle not due to lacking a strategy, but because of improper indicator application and interpretation.
This comprehensive guide covers the four categories of technical indicators for swing trading, the best swing trading indicators with detailed applications, commonly used indicator combinations for confluence, and common mistakes that undermine trading performance.
Quick Answer: The best swing trading indicators are RSI, MACD, Moving Averages, Bollinger Bands, ATR, and OBV. Using 2-3 indicators from different categories (trend, momentum, volume) for confluence is a common practice.
What Are Swing Trading Indicators? And Why Traders Use Them
A swing trading indicator is a mathematical calculation applied to price, volume, or momentum data that helps traders filter market noise, identify trend direction, measure momentum strength, and time entries and exits more precisely.
These technical tools serve a fundamentally different purpose than pure price action analysis or chart pattern recognition. While price action focuses on raw candlestick behavior and chart patterns identify geometric formations, swing trading indicators quantify underlying market dynamics into readable values and visual signals.
A swing trading indicator is a swing trading technical analysis tool that processes historical price, volume, or momentum data to generate signals that help traders identify potential entry and exit points for trades held over several days to weeks.
The 4 Categories of Swing Trading Technical Indicators
Understanding indicator categories clarifies why different tools serve different purposes and how they complement each other in a comprehensive swing trading technical analysis framework.
Trend Indicators (Direction Tools)
Trend indicators for swing trading measure overall market direction and help establish whether the dominant bias is bullish, bearish, or neutral. Examples include Moving Averages (SMA, EMA), Trendlines, and the Average Directional Index (ADX). These tools are typically used for confirming the dominant trend before considering entry positions.
Momentum Oscillators (Speed & Strength Tools)
Momentum oscillators for swing trading measure the speed and strength of price movement, typically oscillating between fixed boundaries. Examples include the Relative Strength Index (RSI), MACD, and Stochastic Oscillator. Traders commonly use these for timing entries, identifying overbought/oversold conditions, and detecting divergence patterns.
Volatility Indicators (Range & Expansion Tools)
Volatility indicators measure how much price is moving regardless of direction. Examples include Bollinger Bands and Average True Range (ATR). These tools prove particularly useful for breakout setups, adjusting stop-loss levels, and identifying periods of market compression before expansion.
Volume Indicators (Conviction Tools)
Volume indicators measure the level of market participation behind price moves. Examples include On-Balance Volume (OBV), standard Volume bars, and Ease of Movement. These tools help confirm breakouts and may indicate stronger market participation.
The Best Indicators for Swing Trading: A Comprehensive List
This section covers some of the most widely used swing trading technical analysis tools, including trend-following indicators, momentum oscillators, volume analyzers, and volatility measures to help traders identify potential trade setups.
Moving Averages (MA): The Foundation of Trend Analysis
Moving averages are foundational indicators for swing trading that smooth price data over a specified period to reveal the underlying trend direction, serving as the foundational trend indicator in technical analysis. Understanding how to use these swing trade indicators for swing trading entry exit signals may help traders refine timing.
Two primary types exist: the Simple Moving Average (SMA), which calculates the arithmetic mean of prices over a period, and the Exponential Moving Average (EMA), which weights recent prices more heavily for faster response to price changes. Swing traders commonly apply moving averages in several ways:
- Trend bias identification: Price trading above the MA suggests bullish bias; price below suggests bearish bias
- Crossover signals: The Golden Cross (50 MA crossing above 200 MA) is often interpreted as a bullish signal, while the Death Cross (50 MA crossing below 200 MA) is viewed as bearish
- Dynamic support/resistance: MAs frequently act as price reaction zones during pullbacks in trending markets
Common application error: Using moving average crossovers in sideways or choppy markets tends to generate false signals, as the indicator is designed for trending conditions.
Relative Strength Index (RSI): The Go-To Momentum Oscillator
RSI is one of the best stock indicators for swing trading and measures the speed and magnitude of recent price changes on a 0-100 scale, indicating potential overbought or oversold conditions. Standard interpretation places readings above 70 as overbought and below 30 as oversold. However, more nuanced application recognizes that in strong uptrends, RSI often oscillates between 40-80 rather than the traditional 30-70 range. Similarly, strong downtrends tend to keep RSI contained between 20-60.
RSI divergence represents one of the indicator's most commonly used applications: when price makes a new high but RSI makes a lower high, this bearish divergence can signal weakening momentum before a price reversal occurs. Swing traders frequently use RSI by:
- Waiting for RSI to pull back to the 40-50 zone during uptrends for potential buy entries
- Monitoring divergence patterns as early reversal warnings
- Combining RSI readings with support/resistance levels for increased precision
Common application error: Selling automatically when RSI reaches 70 during strong trends often results in premature exits, as RSI can remain elevated for extended periods during momentum-driven moves.
MACD (Moving Average Convergence Divergence): Trend + Momentum Combined
MACD is among the best swing trading technical indicators because it displays the relationship between two exponential moving averages, revealing both trend direction and momentum strength in a single indicator. The indicator consists of three components:
- MACD Line: 12-period EMA minus 26-period EMA
- Signal Line: 9-period EMA of the MACD Line
- Histogram: Visual representation of the difference between MACD and Signal lines
Swing traders interpret MACD through several mechanisms:
- MACD line crossing above the signal line suggests bullish momentum
- MACD line crossing below the signal line suggests bearish momentum
- Expanding histogram indicates increasing momentum; contracting histogram suggests fading momentum
- MACD divergence (price making higher highs while MACD makes lower highs) may indicate weakening momentum that some traders interpret as a possible reversal
Example application: When price establishes a higher high but the MACD histogram forms a lower high, this bearish divergence pattern often precedes price corrections.
Common application error: Acting on every MACD crossover in choppy, non-trending markets typically produces whipsaw losses.
Bollinger Bands: The Volatility Tracker Every Swing Trader Needs
Bollinger Bands consist of three lines that expand and contract based on market volatility, providing dynamic support/resistance levels and volatility signals. Key applications for swing trading include:
- Bollinger Band Squeeze: When bands contract significantly, low volatility may precede a breakout.
- Band walk: Price riding the upper or lower band typically indicates strong trend continuation rather than imminent reversal
- Mean reversion: In ranging markets, price touching the outer bands may suggest potential reversal toward the middle band
Example application: A Bollinger Band squeeze on the daily chart followed by price breaking above the upper band with elevated volume often signals the beginning of an extended directional move.
Common application error: Automatically selling when price touches the upper band fails to account for trending conditions where price can "walk" along the upper band for extended periods.
Average True Range (ATR): The Risk Manager's Essential Tool
ATR measures market volatility by calculating the average price range over a specified period, providing objective data for position sizing and stop-loss placement. Unlike directional swing trading indicators, ATR does not indicate whether price will move up or down, only how much it typically moves. This makes it invaluable for risk management applications.
- Stop-loss placement: Setting stops at 1.5x–2x ATR below entry adapts to current market conditions
- Position sizing: Higher ATR readings may warrant smaller position sizes to maintain consistent risk per trade
- Breakout identification: ATR expansion following contraction can confirm genuine breakout momentum
Example application: An ATR reading of $1.50 on a $50 stock indicates a typical daily range of $1.50. Setting a stop-loss at $3.00 below entry (2x ATR) accounts for normal price fluctuation.
Common application error: Using fixed dollar stop-losses (e.g., always $1.00) regardless of volatility often results in premature stop-outs on volatile instruments.
On-Balance Volume (OBV): Confirm Every Move With Volume
OBV is a cumulative volume indicator that adds volume on up days and subtracts volume on down days, revealing buying and selling pressure over time. Many traders use OBV based on the idea that changes in volume may precede price movements; institutional accumulation or distribution often appears in OBV before manifesting in price movement. Swing traders monitor OBV for:
- Trend confirmation: Rising OBV with rising price confirms uptrend strength
- Divergence signals: Falling OBV with rising price (bearish divergence) may indicate weakening buying pressure
- Early breakout signals: OBV breaking to new highs before price breaks resistance can signal institutional accumulation
Example application: Price approaching a resistance level while OBV has already broken to new highs suggests buying pressure may push price through the resistance zone.
Common application error: Ignoring OBV divergence patterns, when OBV and price move in opposite directions, this disconnect can sometimes precede market reversals
Swing Trading Indicators Cheat Sheet
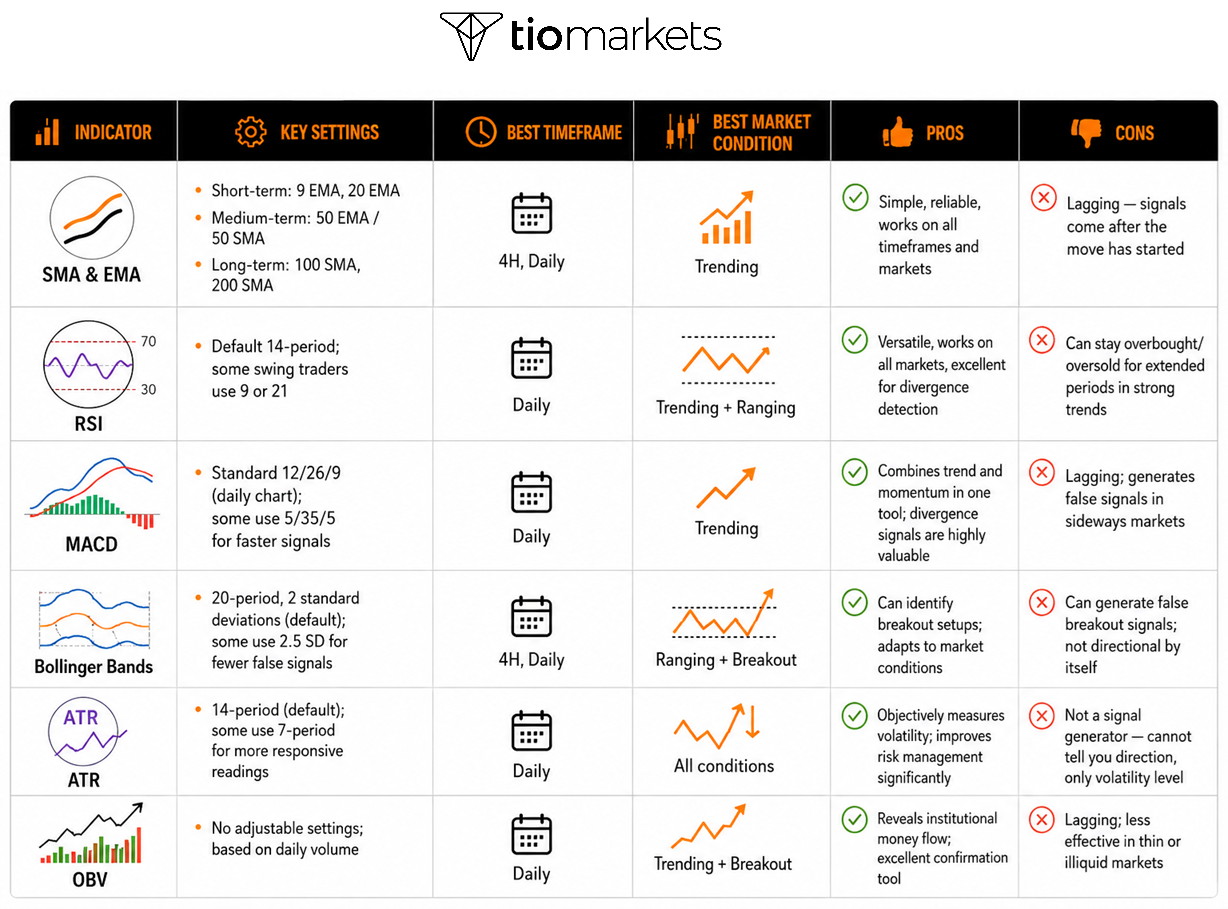
The following graph provides a quick reference for optimal indicator settings, recommended timeframes, and ideal market conditions for each of the swing trading indicators discussed above.
The Best Swing Trading Indicator Combinations (Confluence Strategies)
No single indicator provides perfect swing trading signals across all market conditions. This reality explains why experienced swing traders emphasize confluence, the alignment of multiple independent swing trading indicators pointing toward the same directional bias. The number of indicators doesn't determine success, the quality of confluence does. The best indicators for swing trading work together to confirm swing trading entry exit signals rather than operating in isolation.
Combination 1: EMA + RSI: The Classic Trend + Momentum Setup
This combination uses the 50 EMA to establish trend direction while RSI identifies optimal entry timing during pullbacks. Traders watch for price above the 50 EMA while RSI pulls back to the 40-50 zone. Entry consideration occurs when RSI turns higher with a bullish candlestick.
Combination 2: MACD + Bollinger Bands: Momentum Breakout Setup
This setup combines Bollinger Band squeeze patterns with MACD momentum confirmation for breakout trading. The squeeze identifies low volatility compression, while MACD crossovers confirm breakout direction. Entry consideration occurs when bands contract, followed by MACD bullish crossover and price breaking above the upper band.
Combination 3: RSI Divergence + MACD: Reversal Detection Setup
For identifying potential trend exhaustion, this combination layers two independent momentum indicators for swing trading. RSI divergence provides the primary warning signal, while contracting MACD histogram confirms fading momentum. Entry consideration occurs when bearish divergence appears on RSI and MACD histogram shows declining peaks.
Combination 4: Fibonacci + EMA + Volume: Precision Pullback Entry
This three-layer confluence approach combines price structure, dynamic support, and volume confirmation. Traders draw Fibonacci retracement from swing low to high, monitoring for pullbacks to the 50% or 61.8% level coinciding with the 50 EMA. Rising OBV suggests accumulation rather than distribution.
Combination 5: ATR + Any Entry Signal: Risk Management Layer
ATR functions as a risk management overlay rather than an entry signal generator. Once entry signals are confirmed through other swing trading indicators, ATR provides volatility-adjusted stop-loss placement at 1.5x–2x ATR from entry. This adapts risk management to current conditions rather than using arbitrary fixed stops.
Combining Candlestick Patterns and Swing Trading Indicators
Candlestick patterns and technical indicators serve complementary analytical functions. Candlesticks reveal what market participants are doing through price action psychology, while indicators quantify why through momentum, volume, and trend measurements. Combining both approaches creates more robust trade setups than either method alone.
Key Candlestick Patterns That Work Best With Indicators
A key principle is that trading candlestick patterns in isolation typically produces inconsistent results. Confirming patterns with at least one technical indicator is an approach many traders use to seek additional confirmation. Below are some commonly referenced pattern-indicator combinations that traders use to build confluence.
- Bullish Engulfing + RSI Oversold
- Bearish Engulfing + MACD Bearish Divergence
- Hammer/Doji + Bollinger Lower Band
- Morning Star + Fibonacci 61.8% Level
How to Use the Best Technical Indicators for Swing Trading
Effective swing trading indicator application begins with identifying current market conditions before selecting tools. Trending markets favor moving averages and MACD; ranging markets suit swing trading oscillators like RSI and Stochastic; breakout setups benefit from Bollinger Bands and volume confirmation. Matching swing trade indicators to conditions, rather than forcing the same tools onto every market environment, tends to improve signal quality significantly. Position sizing based on ATR and systematic review of indicator performance help refine application over time.
Common Swing Trading Indicator Mistakes to Avoid
- Using Too Many Indicators (Indicator Overload): Loading five or more indicators onto a chart often creates conflicting signals and analysis paralysis. Limiting analysis to 2-3 indicators from different categories tends to produce clearer signals.
- Treating Indicators as Crystal Balls: Indicators analyze historical data—they do not predict the future. Using indicators for probability assessment rather than certainty, combined with consistent stop-loss discipline, maintains realistic expectations.
- Using the Wrong Indicator for Market Conditions: Moving average crossovers in sideways markets or stochastic signals in strong trends typically generate false signals. Identifying market conditions before selecting indicators improves tool-to-environment matching.
- Ignoring Volume Confirmation: Entering breakouts without checking volume often results in false breakout traps. Above-average volume during price breakouts provides meaningful confirmation.
- Overlooking Divergence Signals: Many traders use RSI only for overbought/oversold levels while missing divergence; one of the most commonly monitored early warning signals available.
- Not Adapting Settings to Timeframe: Default indicator settings are calibrated for specific timeframes. Adjusting periods based on trading timeframe (e.g., shorter RSI periods on 4-hour charts) improves responsiveness.
Conclusion: Building Your Swing Trading Indicators Toolkit
Effective swing trading indicator use requires understanding indicator categories, applying confluence principles, and adapting tools to current market conditions.
Swing Trading Indicators are analytical tools, not guarantees. Their value lies in organizing market data into actionable frameworks, but execution discipline, position sizing, and consistent risk management remain important considerations regardless of the analytical tools used.
To learn more about swing trading at TIOmarkets read here or simply open an account and start practising.

FAQ
Risk disclaimer: CFDs are complex instruments and come with a high risk of losing money rapidly due to leverage. You should consider whether you understand how CFDs work and whether you can afford to take the high risk of losing your money. Never deposit more than you are prepared to lose. Professional client’s losses can exceed their deposit. Please see our risk warning policy and seek independent professional advice if you do not fully understand. This information is not directed or intended for distribution to or use by residents of certain countries/jurisdictions including, but not limited to, USA & Countries included in the OFAC sanction list. The Company holds the right to alter the aforementioned list of countries at its own discretion.
TIOmarkets offers an exclusively execution-only service. The views expressed are for information purposes only. None of the content provided constitutes any form of investment advice. The comments are made available purely for educational and marketing purposes and do NOT constitute advice or investment recommendation (and should not be considered as such) and do not in any way constitute an invitation to acquire any financial instrument or product. TIOmarkets and its affiliates and consultants are not liable for any damages that may be caused by individual comments or statements by TIOmarkets analysis and assumes no liability with respect to the completeness and correctness of the content presented. The investor is solely responsible for the risk of his/her investment decisions. The analyses and comments presented do not include any consideration of your personal investment objectives, financial circumstances, or needs. The content has not been prepared in accordance with any legal requirements for financial analysis and must, therefore, be viewed by the reader as marketing information. TIOmarkets prohibits duplication or publication without explicit approval.
Join us on social media



Authors BIO

Maria is a writer and content strategist with over 10 years of experience in the finance industry. She specializes in developing research-backed articles that help financial professionals navigate complex market topics with confidence. Her expertise spans forex, stocks, CFDs and global markets, creating insightful content that educates readers and supports informed decision-making.





