CADJPY Technical Analysis | Lower Swing High
BY Janne Muta
|October 30, 2023CADJPY technical analysis - The CADJPY currency pair has retraced over 3% from the September high. This increase in downside volatility followed the weakness in the crude oil price. The USOIL market has traded lower by over 8% since September 29th, the day the CADJPY market peaked.
We expect to see increased volatility tomorrow with the Bank of Japan policy rate decision and the Canadian GDP release. The analyst consensus expects the BOJ to keep the interest rates unchanged at -0.10%, therefore leaving the market vulnerable to the element of surprise. The Canadian GDP growth month-over-month is projected to inch higher by 0.1%.
Summary of this CADJPY technical analysis report
- The CADJPY weekly chart indicates a 3% retracement to a technical confluence. The trend remains upward, but a lack of buyers might push it to 106.00 or 104.22-104.60. Rally potential: 108.90.
- The CADJPY daily chart shows a lower swing high at 109.98 after a failed rally attempt. A potential break below 107.62 and 107.15 is indicated. The market is oversold but could drop further. Resistance: 109.98.
- The 4-hour CADJPY chart shows resistance at 108.47-108.55, influenced by market structure and a 20-period average. Another resistance is at 108.88-108.95. A move above 108.95 could lead to 109.90.
Read our full CADJPY technical analysis report below.
CADJPY Technical Analysis

CADJPY Technical Analysis, Weekly
The weekly chart shows a 3% retracement from the September high at 111.16. This retracement has brought the CADJPY currency pair to a technical confluence area where the 20-period moving average, the 20 3.6% 3.0 retracement level, and a market structure level are closely aligned. At the same time, the stochastic oscillator has moved to the oversold threshold.
Overall, the weekly trend in this currency pair is still up. However, should the market fail to attract buyers at this confluence area, we should look for a move to the lower end of the bull channel (currently at 106.00) the market is trading in.
The next confluence area below the channel low is at 104.22-104.60. If the channel low doesn't hold, the market could trade down to this confluence area created by the 38.2% Fibonacci retracement level and a market structure level (July low).
Alternatively, if the market rallies from the current levels, we should look for a move to 108.90 or so.
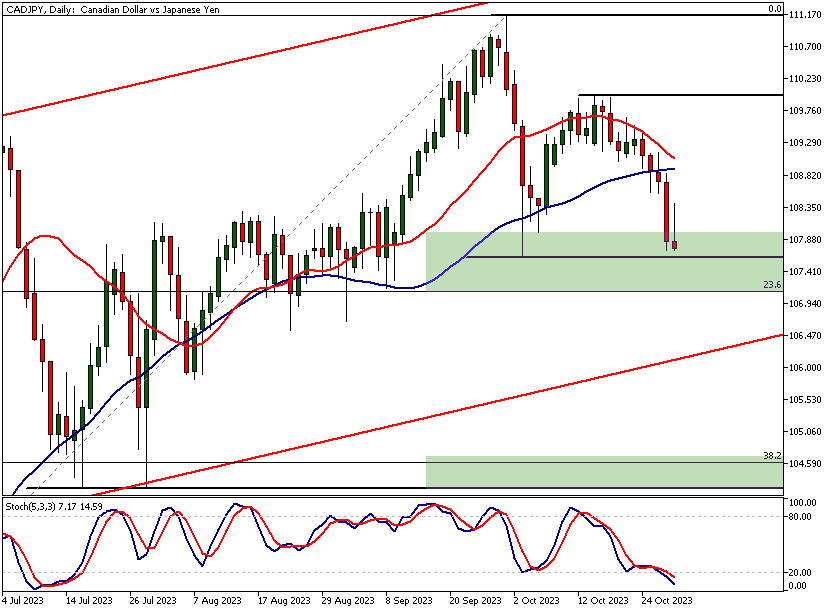
CADJPY Technical Analysis, Daily
The daily chart reveals how the CADJPY currency pair has created a lower swing high at 109.98. This follows a failed attempt to rally the market beyond the September 2022 high. As such, the lower swing high could result in the market breaking below the 107.62 support level and possibly below the 23.6% Fibonacci retracement level at 107.15.
The stochastic oscillator is deeply in the oversold territory on the daily chart, suggesting that the market is oversold in this timeframe. However, lower swing highs quite often lead to lower prices, and therefore the market could become even more oversold before it is ready to possibly continue the uptrend.
The nearest key resistance level in this timeframe is the swing high at 109.98.
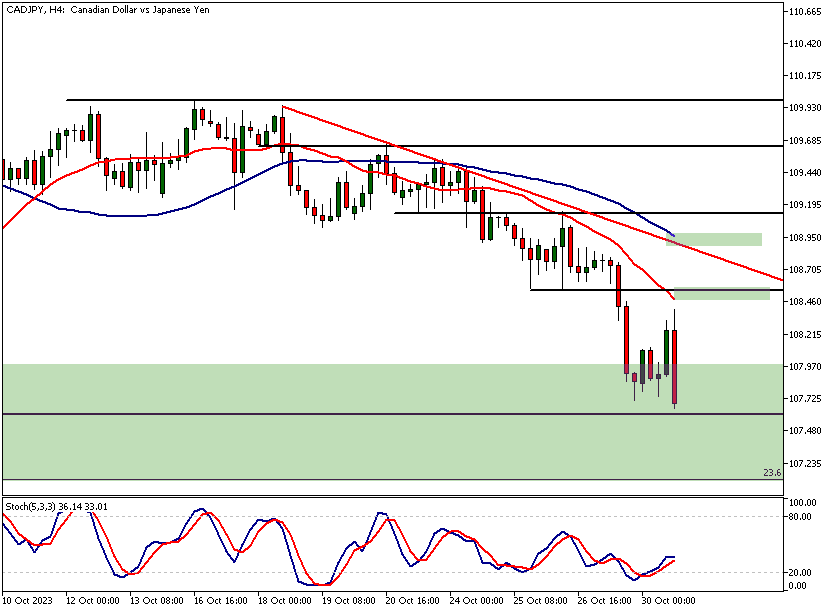
CADJPY Technical Analysis, 4h
The 4-hour CADJPY chart indicates resistance in the 108.47-108.55 range, influenced by market structure and a 20-period average. Another resistance can be found in the 108.88-108.95 range. If there's a move above 108.95, it could lead to a rise towards 109.90.
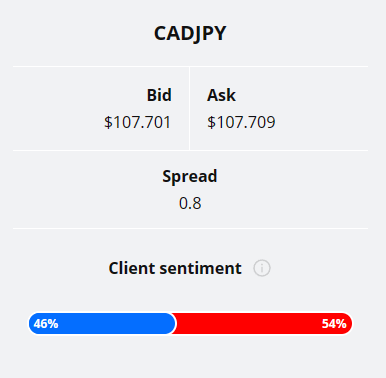
Client sentiment analysis
TIOmarkets clients are very mildly bearish on CADJPY with 54% of clients holding short positions and 46% holding long positions in the market.
Please remember that the retail trader client sentiment is a contrarian indicator as most of the retail traders are on average betting against the market trends. This is why, experienced traders tend to trade against the retail client sentiment. You can follow the TIOmarkets client sentiment live on our Forex dashboard.
The Next Key Risk Events
- The BoJ Rate Decision
- Canadian GDP

Potential CADJPY market moves
The CADJPY shows potential for a reversal, with the stochastic oscillator indicating oversold conditions. If buyers converge at the current technical confluence, we could see a rally towards 108.90.
Despite the upward weekly trend, CADJPY's lower swing high and the potential breach of the 107.62 support hint at a downturn. If the bull channel's lower end doesn't hold, a drop to the 104.22-104.60 confluence zone is plausible.
How would you trade CADJPY today?
I hope this fundamental and technical CADJPY analysis helps you to make better informed trading decisions. Check the latest market analysis for other instruments and subscribe to receive them in your inbox as soon as they are published.
DISCLAIMER: TIO Markets offers an exclusively execution-only service. The views expressed are for information purposes only. None of the content provided constitutes any form of investment advice. The comments are made available purely for educational and marketing purposes and do NOT constitute advice or investment recommendation (and should not be considered as such) and do not in any way constitute an invitation to acquire any financial instrument or product. TIOmarkets and its affiliates and consultants are not liable for any damages that may be caused by individual comments or statements by TIOmarkets analysis and assumes no liability with respect to the completeness and correctness of the content presented. The investor is solely responsible for the risk of his/her investment decisions. The analyses and comments presented do not include any consideration of your personal investment objectives, financial circumstances, or needs. The content has not been prepared in accordance with any legal requirements for financial analysis and must, therefore, be viewed by the reader as marketing information. TIOmarkets prohibits duplication or publication without explicit approval.
Join us on social media

Janne Muta holds an M.Sc in finance and has over 20 years experience in analysing and trading the financial markets.
Related Posts


Trade responsibly: CFDs are complex instruments and come with a high risk of losing all your invested capital due to leverage.