DAX Technical Analysis | Are the bulls ready to challenge the December high?
BY Janne Muta
|January 2, 2024Dax technical analysis - The DAX exhibits renewed bullishness today as traders anticipate key macroeconomic data releases from Europe and the US. These data precede Friday's US payroll reports and could offer insights to DAX traders and investors about the potential policy directions of the ECB and the Fed for this year.
The first anticipated report is the US ISM Manufacturing PMI, scheduled for release tomorrow. In November, the index remained at 46.7, indicating a persistent contraction in the manufacturing sector The forthcoming ISM Manufacturing PMI release is expected to show a modest increase to 47.2, according to analysts.
In addition, the JOLTS job openings for December will be released tomorrow. A slight recovery to 8.85 million is anticipated by analysts.
Furthermore, on Wednesday, the FOMC meeting minutes will be published following the Federal Reserve's decision in December 2023 to maintain the federal funds rate at 5.25%-5.5%, reflecting the economic slowdown. Despite moderate job gains and low unemployment, inflation remains a concern, albeit with signs of easing. The Fed's updated projections for 2023 are optimistic, but they adopt a cautious stance for 2024, with lowered PCE inflation rates and stable unemployment projections. The projected federal funds rate for the end of 2024 has been adjusted downwards, indicating a shift in expectations for monetary policy.
On Friday, before the US payrolls (+168K expected) we will receive the Euro Area inflation figures. Analysts expect a rise in headline inflation (projected at 3.0%, up from 2.4%) while the Core CPI is anticipated to decrease further (3.4% expected, down from 3.6% prior).
Summary of This Dax Technical Analysis Report:
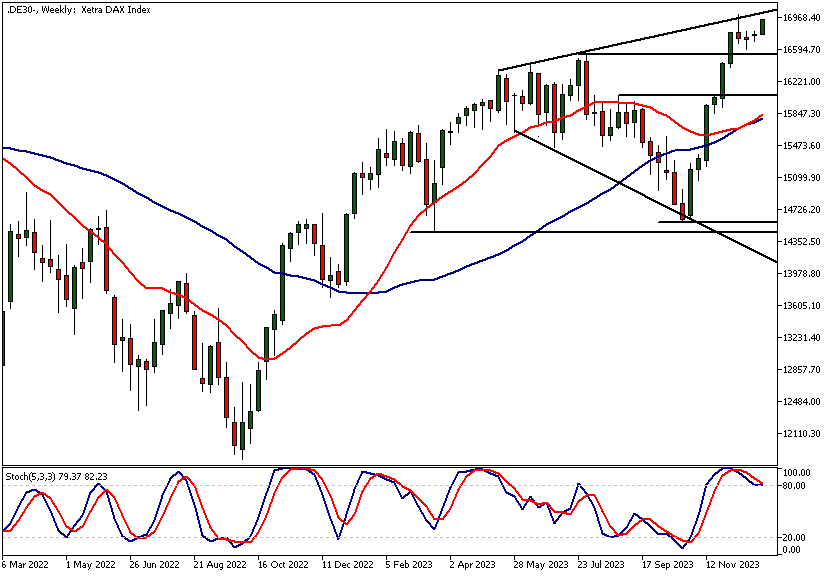
- The DAX shows renewed bullish momentum after a period of sideways trading during Christmas. The higher lows each week indicate returning buying pressure. A key challenge is surpassing the 17,003 high, a level significant due to December's profit-taking. The 17,003 mark also aligns with a key trendline from last summer's widening top formation.
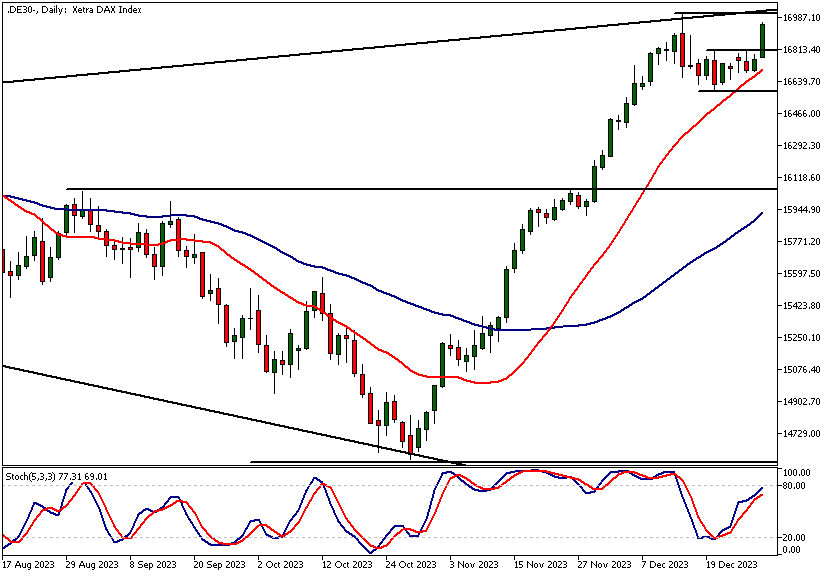
- On the daily chart, the DAX has broken out of a sideways range. The 16,804 level, the range high, now serves as crucial support. A retracement here could attract buyers. The SMA(20) at 16,700 provides additional support. The market's strength is evident as it trades above the SMA(20).
- In the 8-hour timeframe, the DAX's technical picture mirrors the daily chart, displaying a strong breakout from the sideways range. This suggests potential continuation of the uptrend. The moving averages, pointing upwards, support bullish Dax technical analysis. Key support and resistance are identified at 16,804 and 17,003, respectively.
Read the full Dax Technical Analysis report below.
Dax Technical Analysis
Weekly Dax Technical Analysis
The DAX is trading higher again after losing momentum and trading sideways over the Christmas period. Last week's low was higher than the previous week's low, suggesting that buying pressure is returning to the market.
The next challenge for the bulls is surpassing the 17,003 high, which formed when pre-Christmas profit-taking halted the DAX index's upward movement in December. Traders were keen to bank the significant profits generated during the Santa Claus rally, which saw the market increase by over 16% in just seven weeks. The December high at 17,003 roughly aligns with the trendline drawn last summer, as the market was forming a widening top formation.
According to DAX technical analysis, the nearest support level at 16,590 is crucial for the market to maintain its bullish stance. Below this level, the bears could target 16,460. To keep the market bullish above 17,003, the bulls need to achieve a convincing breakout beyond this level and then sustain the market above the December high. Failure to do so increases the risk of the DAX slipping back and continuing its consolidation within the 16,590 - 17,003 range.
Daily Dax Technical Analysis
The DAX has broken out of a sideways range formation on the daily chart. Following this, the range high at 16,804 becomes a key support level. A potential retracement to this level may attract buyers looking to join the uptrend. The SMA(20) at 16,700 offers another reference point below the 16,804 level and could serve as dynamic support to the market.
Moving average-based DAX technical analysis indicates that the market remains strong, with both SMAs pointing higher and the market trading well above the SMA(20). The stochastic oscillator is nearing the overbought area as the market approaches the December high of 17,003.

Intraday Dax Technical Analysis
The technical outlook in the 8-hour timeframe aligns with the daily chart. The strong breakout move higher from the sideways range suggests that the market could resume its uptrend after a brief pause.
The moving averages are also pointing higher in this timeframe, indicating that our DAX technical analysis should focus on identifying long-side market opportunities. The nearest support and resistance levels in the 8-hour chart are 16,804 and 17,003, respectively.
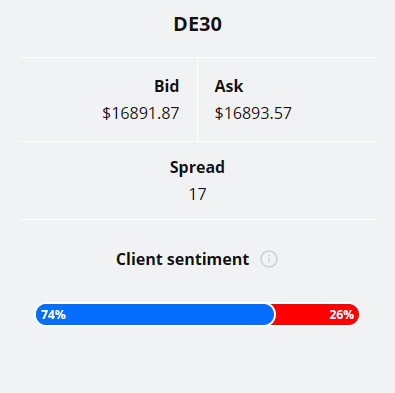
Client sentiment analysis
74% of clients trading DAX are holding long positions, while 26% are holding short positions. Client sentiment data is being provided by TIO Markets Ltd.
It’s good to remember that retail client trading sentiment is a contrarian indicator as most retail traders are on average trading against market price trends. This is why experienced traders tend to trade against the retail client sentiment. You can follow the TIOmarkets client sentiment live on our Forex dashboard.
The next key risk events impacting this market
- FOMC Member Barkin Speaks
- ISM Manufacturing PMI
- JOLTS Job Openings
- ISM Manufacturing Prices
- FOMC Meeting Minutes
- German Prelim CPI m/m
- ADP Non-Farm Employment Change
- Unemployment Claims
- Construction PMI
- Core CPI Flash Estimate y/y
- CPI Flash Estimate y/y
- Average Hourly Earnings m/m
- Non-Farm Employment Change
- ISM Services PMI
- FOMC Member Barkin Speaks
Potential Dax Market Moves
In the bullish scenario, if the DAX sustains its momentum above the 17,003 level, a breakout beyond this point could signal a continuation of the uptrend, potentially targeting higher resistance levels. Conversely, in the bearish scenario, a break below the key support level at 16,590 might lead to a decline towards 16,460, indicating a shift in market sentiment towards a more cautious stance.

How Would You Trade the Dax Today?
I hope this fundamental and technical Dax analysis helps you to make better informed trading decisions. Check the latest market analysis for other instruments and subscribe to receive them in your inbox as soon as they are published
DISCLAIMER: TIO Markets offers an exclusively execution-only service. The views expressed are for information purposes only. None of the content provided constitutes any form of investment advice. The comments are made available purely for educational and marketing purposes and do NOT constitute advice or investment recommendation (and should not be considered as such) and do not in any way constitute an invitation to acquire any financial instrument or product. TIOmarkets and its affiliates and consultants are not liable for any damages that may be caused by individual comments or statements by TIOmarkets analysis and assumes no liability with respect to the completeness and correctness of the content presented. The investor is solely responsible for the risk of his/her investment decisions. The analyses and comments presented do not include any consideration of your personal investment objectives, financial circumstances, or needs. The content has not been prepared in accordance with any legal requirements for financial analysis and must, therefore, be viewed by the reader as marketing information. TIOmarkets prohibits duplication or publication without explicit approval.
Join us on social media

Janne Muta holds an M.Sc in finance and has over 20 years experience in analysing and trading the financial markets.
Related Posts


Trade responsibly: CFDs are complex instruments and come with a high risk of losing all your invested capital due to leverage.