DAX Technical Analysis | Cooling inflation supports equities
BY Janne Muta
|November 16, 2023DAX Technical Analysis – The DAX continued its upward rally as US economic data boosted major equity indices in the US propelling the highly correlated Dax index higher also. Unemployment claims in the US rose to 231K, surpassing forecasts and hinting at a potential slowdown in the labour market.
While high interest rates might be beginning to impact the US job market, the manufacturing sector is also under pressure. The Philly Fed Manufacturing Index improved to -5.9, indicating a less severe contraction in manufacturing than anticipated.
However, industrial production unexpectedly declined by 0.6%, highlighting challenges in manufacturing, mining, and utilities. This mixed economic scenario, characterized by high yet cooling inflation, is in line with expectations that the Federal Reserve may start cutting rates next year. Such a move would be in response to signs of economic slowing and to foster growth.
Summary of This Dax Technical Analysis Report:
- Over the past three weeks, the DAX has experienced a notable rally, climbing almost 8%, with approximately 4% of this growth occurring since the bullish breakout two weeks ago. Currently, the market is nearing a significant resistance level at 16,044.
- In the daily chart, the DAX index created a higher swing low at 15,067 before breaking out of the bearish trend channel. The nearest major technical resistance level is now approximately 1% away,
- The uptrend in the 2h chart is also strong with the key support levels at 15,365, 15,605, and 15,703. Upside momentum indicates more upside potential until either the news flow changes or the market reaches a major higher timeframe resistance level.
Read the full Dax Technical Analysis report below.
Dax Technical Analysis
Weekly Dax Technical Analysis
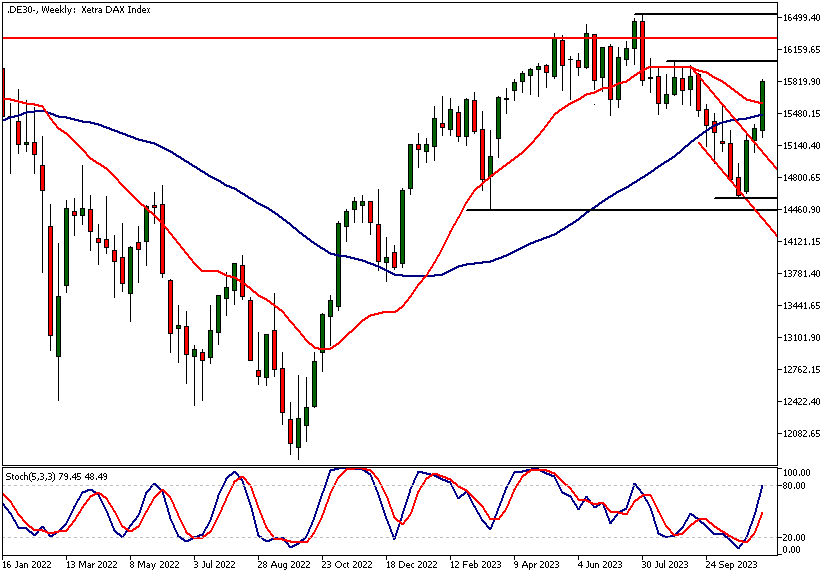
Over the past three weeks, the DAX has experienced a notable rally, climbing almost 8%, with approximately 4% of this growth occurring since the bullish breakout two weeks ago. Currently, the market is nearing a significant resistance level at 16,044, a movement that has pushed the stochastic oscillator into the overbought zone with a threshold of 80.
Strong correlation with the S&P 500
Given the DAX's strong correlation with the S&P 500, we often see its performance mirroring the trends in US equity indices. As such, the continued bullishness in US indices is likely to support further strength in the DAX.
This upward trend in the DAX commenced following its formation of a higher swing low, which was relatively close to a pivotal low created in March. Dax technical analysis suggests that this higher low, coupled with the robust rally that ensued, signals potential for additional upward movement in the market.
Daily Dax Technical Analysis
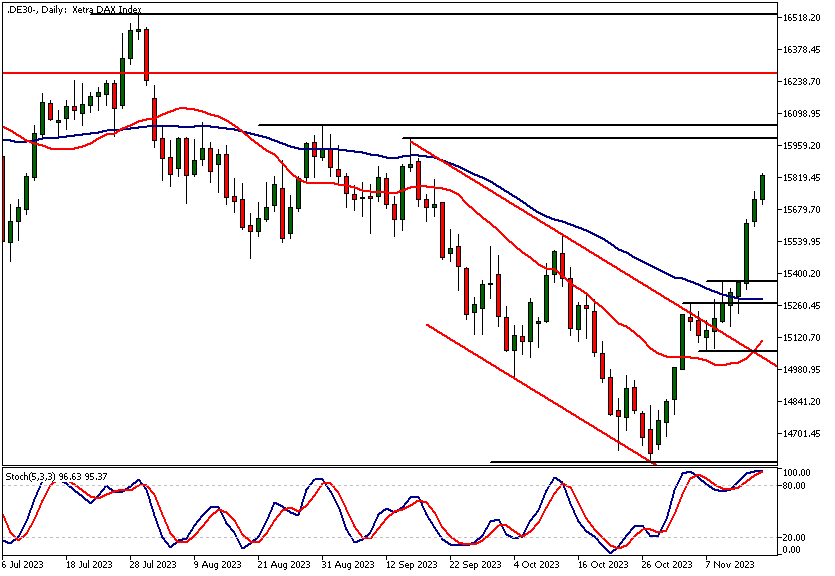
In the daily chart, the DAX index created a higher swing low at 15,067 before breaking out of the bearish trend channel. The nearest major technical resistance level is now approximately 1% away, and if the current strength in the market continues, we could see this level tested fairly soon. In the case of the market correcting lower, the nearest daily support level can be found at a level as low as 15,365.
Traders relying on indicator-oriented DAX technical analysis have probably noticed how the stochastic oscillator has been in the overbought zone for quite some time. If they have shorted the market, they have either lost money or fuelled the upside move with their buy stops getting triggered.
Potential targets
If this weakness cannot be reversed and the market fails to decidedly break above the 15,268 high, we might see it trading down to 14,600 again. There aren't many support levels above this major low. Alternatively, a strong rally above 15,268 would open the way to 15,560 or so.
Dax Technical Analysis, 2h
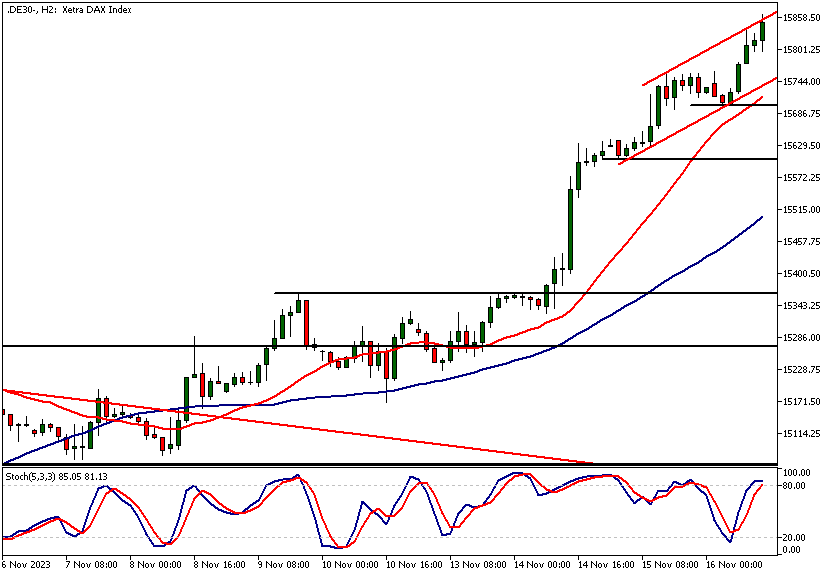
The uptrend in the 2h chart is also strong with the key support levels at 15,365, 15,605, and 15,703. Upside momentum indicates more upside potential until either the news flow changes or the market reaches a major higher timeframe resistance level.
In the case of the market potentially correcting lower, we should monitor price action at the forementioned support levels to see whether buyers are re-engaging with the market. Technical indicator-based DAX technical analysis suggests the market remains strong as the 20-period moving average is well above the 50-period.
Additionally, the moving average is pointing higher, supporting the bullish interpretation. Note also that the bull channel low is somewhat closely aligned with the 20-period moving average (currently at 15,715).
Client sentiment analysis
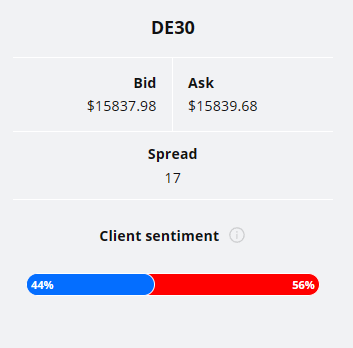
No indication is provided by the TIOmarkets' client positioning as 44% are bullish on Dax, while 56% are short.
Please remember that the retail trader client sentiment is a contrarian indicator as most of the retail traders are on average betting against the market trends. This is why, experienced traders tend to trade against the retail client sentiment. You can follow the TIOmarkets client sentiment live on our Forex dashboard.
The next key risk events impacting this market:
- ECB President Lagarde's Speech
- US Building Permits
- US Existing Home Sales (3.96M)
- ECB President Lagarde Speaks
- US FOMC Meeting Minutes

Potential Dax Market Moves
In the daily chart, the DAX index created a higher swing low at 15,067 before breaking out of the bearish trend channel. The nearest major technical resistance level is now approximately 1% away, and if the current strength in the market continues, we could see this level tested fairly soon. In the case of the market correcting lower, the nearest daily support level can be found at a level as low as 15,365.
How would you trade the Dax today?
I hope this Dax technical analysis helps you to make better informed trading decisions. Check the latest market analysis for other instruments and subscribe to receive them in your inbox as soon as they are published
DISCLAIMER: TIO Markets offers an exclusively execution-only service. The views expressed are for information purposes only. None of the content provided constitutes any form of investment advice. The comments are made available purely for educational and marketing purposes and do NOT constitute advice or investment recommendation (and should not be considered as such) and do not in any way constitute an invitation to acquire any financial instrument or product. TIOmarkets and its affiliates and consultants are not liable for any damages that may be caused by individual comments or statements by TIOmarkets analysis and assumes no liability with respect to the completeness and correctness of the content presented. The investor is solely responsible for the risk of his/her investment decisions. The analyses and comments presented do not include any consideration of your personal investment objectives, financial circumstances, or needs. The content has not been prepared in accordance with any legal requirements for financial analysis and must, therefore, be viewed by the reader as marketing information. TIOmarkets prohibits duplication or publication without explicit approval.

Janne Muta holds an M.Sc in finance and has over 20 years experience in analysing and trading the financial markets.
Related Posts


Trade responsibly: CFDs are complex instruments and come with a high risk of losing all your invested capital due to leverage.