DAX Technical Analysis | ECB's Lagarde suggests continued high interest rates
BY Janne Muta
|January 18, 2024Dax technical analysis - Christine Lagarde, President of the European Central Bank (ECB), recently hinted at a possible change in interest rate policy. Speaking in Davos, she maintained a hawkish stance, suggesting the decline in inflation may be uneven and high interest rates could continue.
However, she indicated rates may have peaked, hinting at a cautious approach towards rate cuts, balancing inflation control with easing monetary policy.
A consensus is forming among policymakers on interest rates, yet decisions will be based on economic data. The ECB is wary of wage-related inflation risks and awaits more data, with a potential rate cut hinted for June.
Market reactions led to a reduced expectation of ECB rate cuts for the year. Previously, six quarter-point reductions were expected, but this has been adjusted to five, with a 60% chance of a sixth. This aligns with the ECB's data-dependent approach and the need for evidence of controlled inflation.
Lagarde's remarks significantly influence European stocks and the broader financial market, affecting borrowing cost expectations and economic growth.
Summary of This Dax Technical Analysis Report:
- The Dax has been creating lower weekly highs in what could turn out to be a short to medium-term market top. Our Dax technical analysis suggests that if this weakness continues the next key support level at 16,044 could come into play. Alternatively, look for a move to 16,960 - 17,000.
- As the DAX has traded lower on three consecutive days it has almost reached the SMA(50) yesterday. The nearest key resistance levels are at 16,533 which is the old ATH level created in July last year and 16,607, a level fairly close to the SMA(20). The next support level can be found at 16,044.
- The 4h confluence areas: The nearest at 16,514 - 16,607 is created by the July ATH level, the 38.2% Fibonacci retracement and the SMA(20). The 50% retracement level at 16,567 and a resistance level at 16,581 forms the next. Above this, the 61.8% retracement level together with the SMA(50) and a market structure level at 16,606 -16,621 create the last zone.
Read the full Dax Technical Analysis report below.
Dax Technical Analysis
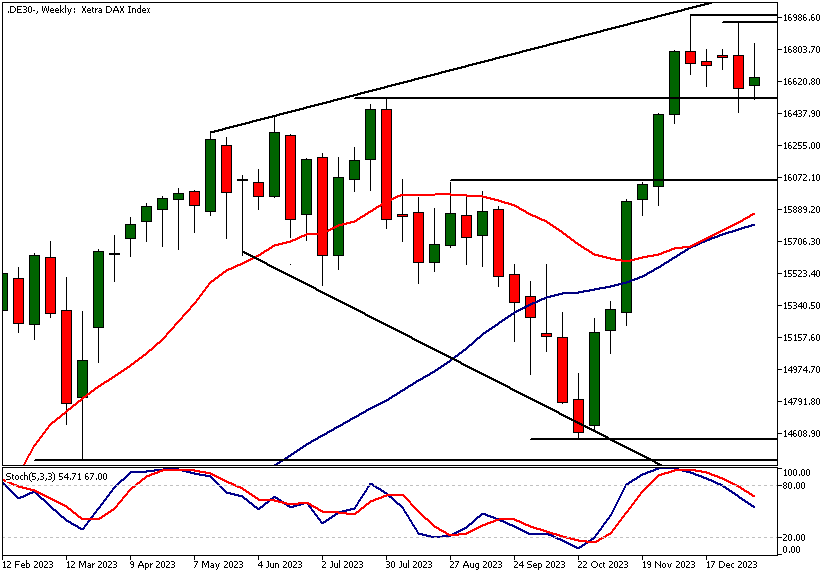
Weekly Dax Technical Analysis
The Dax has been creating lower weekly highs in what could turn out to be a short to medium-term market top. The moving averages are still pointing higher with the SMA(20) above the SMA(50) but the Stochastic oscillator indices lack of upside momentum as it points lower.
Our Dax technical analysis suggests that if this weakness continues the next key support level at 16,044 could come into play. Alternatively, look for a move to 16,960 - 17,000.
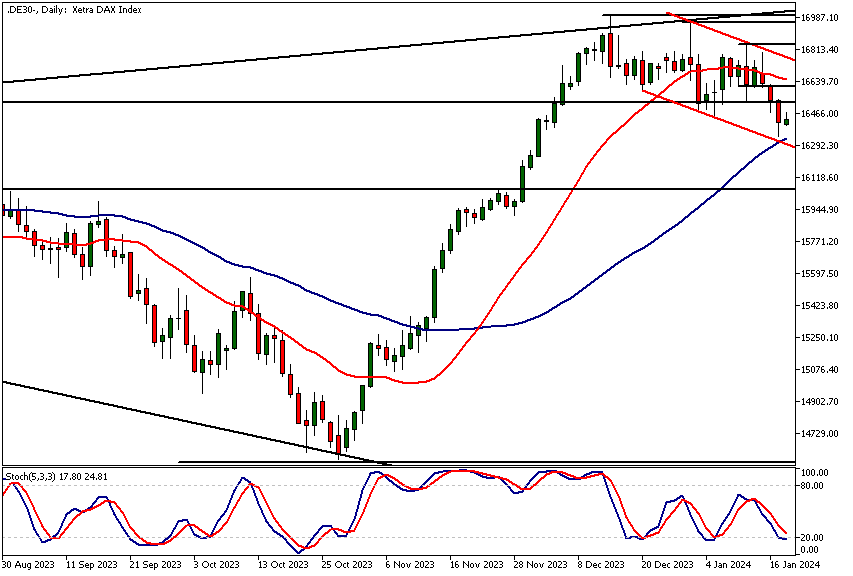
Daily Dax Technical Analysis
As the DAX has traded lower on three consecutive days it has almost reached the SMA(50) yesterday. The Dax is trading in a bearish trend channel and the channel low is somewhat closely aligned with the SMA(50).
Moving averages-based Dax technical analysis agrees with the price action action-oriented analysis as the SMA(20) is pointing downwards. The nearest key resistance levels are at 16,533 which is the old ATH level created in July last year and 16,607, a level fairly close to the SMA(20). The next support level can be found at 16,044.
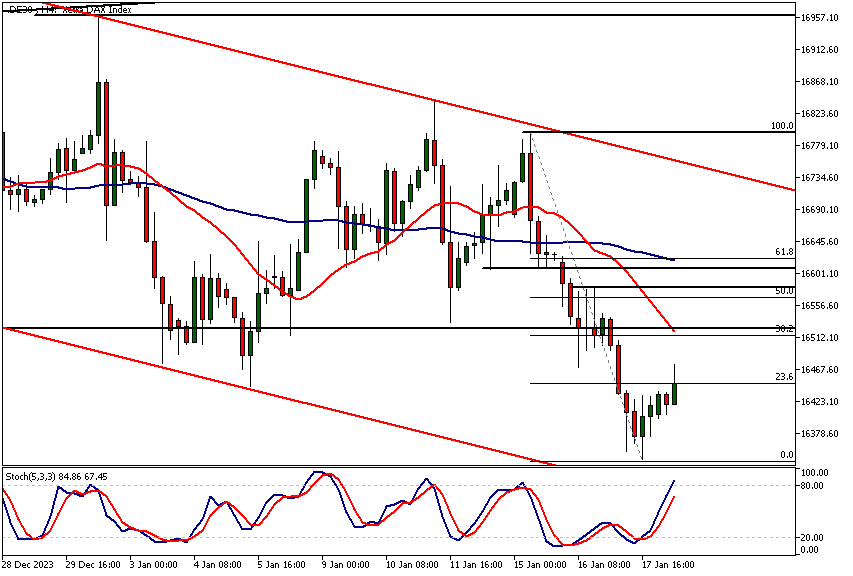
Intraday Dax Technical Analysis
The 4h chart reveals interesting technical confluence levels that could act as important resistance areas should the market rally back to them. The nearest at 16,514 - 16,607 is created by the July ATH level, the 38.2% Fibonacci retracement and the SMA(20).
The 50% retracement level at 16,567 and a resistance level at 16,581 forms the next. Above this, the 61.8% retracement level together with the SMA(50) and a market structure level at 16,606 -16,621 create the last zone.
Moving averages are pointing lower thus agreeing with the bearish view given by the price action action-based DAX technical analysis.
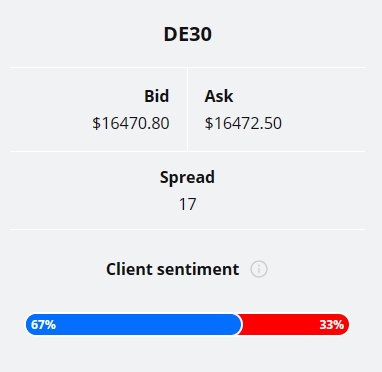
Client sentiment analysis
67% of clients trading DAX are holding long positions, while 33% are holding short positions. Client sentiment data is being provided by TIO Markets Ltd.
Please note that retail client trading sentiment is generally a contrarian indicator, as private (non professional) traders, on average, trade against market price trends. You can follow the TIOmarkets client sentiment live on our Forex dashboard.
The next key risk events impacting this market
- USD - Unemployment Claims
- USD - Building Permits
- USD - Philly Fed Manufacturing Index
- EUR - ECB President Lagarde Speaks
- EUR - ECB President Lagarde Speaks
- USD - Prelim UoM Consumer Sentiment
- USD - Existing Home Sales
- USD - Prelim UoM Inflation Expectations
Potential Dax Market Moves
Our weekly Dax technical analysis suggests that if this weakness continues the next key support level at 16,044 could come into play. Alternatively, look for a move to 16,960 - 17,000.

How Would You Trade the Dax Today?
I hope this fundamental and technical Dax analysis helps you to make better informed trading decisions. Check the latest market analysis for other instruments and subscribe to receive them in your inbox as soon as they are published
DISCLAIMER: TIO Markets offers an exclusively execution-only service. The views expressed are for information purposes only. None of the content provided constitutes any form of investment advice. The comments are made available purely for educational and marketing purposes and do NOT constitute advice or investment recommendation (and should not be considered as such) and do not in any way constitute an invitation to acquire any financial instrument or product. TIOmarkets and its affiliates and consultants are not liable for any damages that may be caused by individual comments or statements by TIOmarkets analysis and assumes no liability with respect to the completeness and correctness of the content presented. The investor is solely responsible for the risk of his/her investment decisions. The analyses and comments presented do not include any consideration of your personal investment objectives, financial circumstances, or needs. The content has not been prepared in accordance with any legal requirements for financial analysis and must, therefore, be viewed by the reader as marketing information. TIOmarkets prohibits duplication or publication without explicit approval.

Janne Muta holds an M.Sc in finance and has over 20 years experience in analysing and trading the financial markets.
Related Posts


Trade responsibly: CFDs are complex instruments and come with a high risk of losing all your invested capital due to leverage.