DAX Technical Analysis | Hesitation at bear channel high
BY Janne Muta
|January 23, 2024Dax technical analysis - Dax has rallied together with the US stock market lately as the US economy has shown resilience with a significant drop in initial jobless claims. Dax is highly correlated with the S&P 500, with the current 6-month correlation at 70% (0.7).
This is a high positive correlation, meaning the markets are likely to move in the same direction. Therefore, the drivers for Dax performance aren't limited to Europe only, but the economic developments in the US and the performance of the US stock market have a strong impact on the index.
Recently, investor expectations regarding Federal Reserve interest rate cuts have moderated, but improving US consumer confidence in January helped the main equity indices to rally. Furthermore, the University of Michigan’s index climbed to 78.8 and inflation expectations for the following year dropped to 2.9% supported stocks.
On Thursday, the US Commerce Department is set to release its initial estimate of the Q4 2023 GDP. According to economists output of all goods and services is anticipated to have expanded at a rate of 2% in the last quarter of 2023. This rate would represent the slowest growth since the 0.6% contraction in the second quarter of 2022.
Summary of This Dax Technical Analysis Report:
- Last week, the Dax formed a bullish rejection candle, indicating that bulls are aiming to drive the market higher, possibly testing the recent all-time high levels at 17,000. However, a decisive break above last week's high (16,794) is needed to make this a probable scenario.
- The daily chart shows how the market tried to break out of a bearish trend channel this morning. If the breakout fails and the market moves lower, a move down to 16,530 could be likely. Above the channel high, look for a move to 16,850.
Read the full Dax Technical Analysis report below.
Dax Technical Analysis
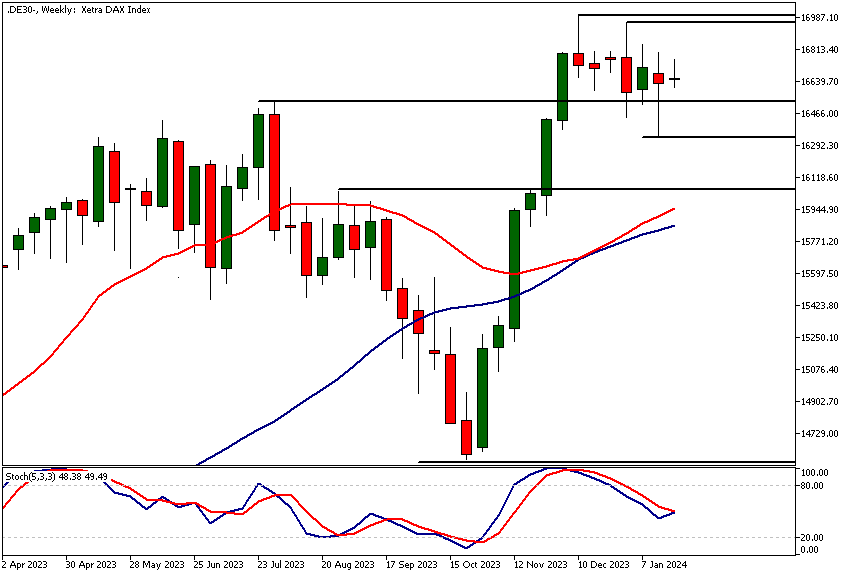
Weekly Dax Technical Analysis
Last week, the Dax formed a bullish rejection candle, indicating that bulls are aiming to drive the market higher, possibly testing the recent all-time high levels at 17,000. However, a decisive break above last week's high (16,794) is needed to make this a probable scenario.
The stochastic oscillator is on the verge of giving a buy signal, while the moving average is pointing higher, with the SMA 20 above the slower SMA 50. The market has been consolidating above the previous all-time high level at 16,531, and any moves below this level have been rejected, suggesting buying pressure in the market.
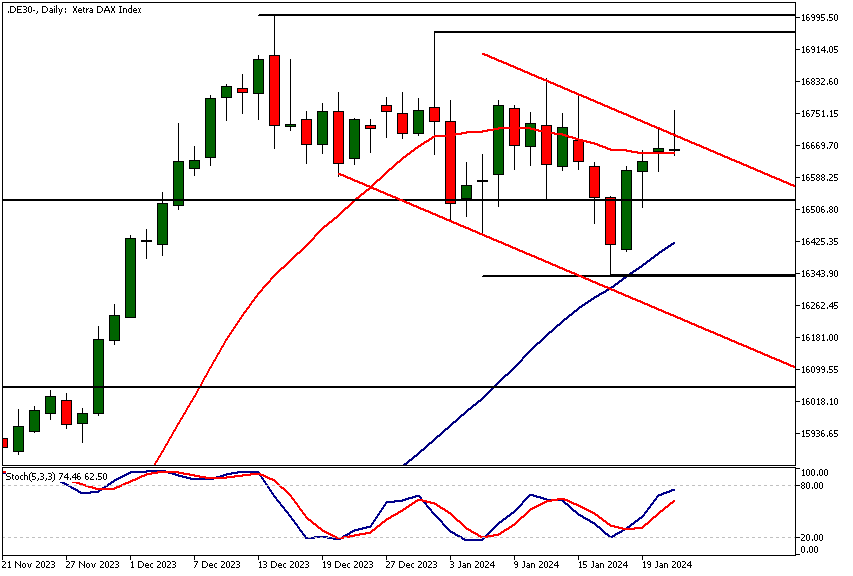
Daily Dax Technical Analysis
The daily chart shows how the market tried to break out of a bearish trend channel this morning. The move was rejected and DAX is once again trading below the bear channel top. If the breakout fails and the market moves lower, a move down to 16,530 could be likely. Above the channel high, look for a move to 16,850.
If the break out from the channel is successful a measured move Target at 17,162 could eventually become relevant. this would mean the index breaking into new all-time highs though and before this, the bulls need to deal with potential Supply around the latest all-time high level at 17,000.
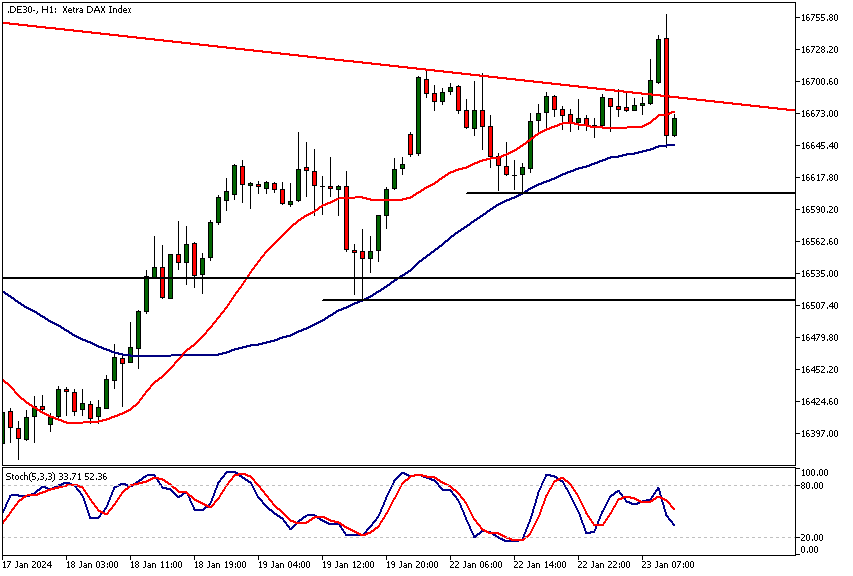
Intraday Dax Technical Analysis
The latest complete 1h candle indicates weakness as it is a wide-range candle with a close below the previous candle's low. If the weakness continues a move down to 16,600 could be likely. Alternatively, if there is a strong rally above today's high (16,758) a move to 16,780 - 16,800 could take place. The SMA50 has provided support to the market at the time of writing this and Dax has recovered slightly. the nearest key price levels below are 16,511 and 16,604.
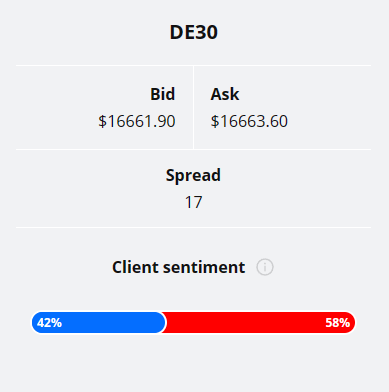
Client sentiment analysis
42% of clients trading DAX are holding long positions, while 58% are holding short positions. Client sentiment data is being provided by TIO Markets Ltd.
Please note that retail client trading sentiment is often said to be a contrarian indicator. This is because trade data suggests that private (non-professional) traders, on average, trade against market price trends. You can follow the TIOmarkets client sentiment live on our Forex dashboard.
The next key risk events impacting this market
- USD - Richmond Manufacturing Index
- EUR - French Flash Manufacturing PMI
- EUR - French Flash Services PMI
- EUR - German Flash Manufacturing PMI
- EUR - German Flash Services PMI
- EUR - Flash Manufacturing PMI
- EUR - Flash Services PMI
- USD - Flash Manufacturing PMI
- USD - Flash Services PMI
- EUR - German ifo Business Climate
- EUR - Main Refinancing Rate
- EUR - Monetary Policy Statement
- USD - Advance GDP q/q
- USD - Unemployment Claims
- USD - Advance GDP Price Index q/q
- USD - Core Durable Goods Orders m/m
- USD - Durable Goods Orders m/m
- EUR - ECB Press Conference
- USD - New Home Sales
- USD - Core PCE Price Index m/m
- USD - Pending Home Sales m/m
Potential Dax Market Moves
The daily chart shows how the market tried to break out of a bearish trend channel this morning. If the breakout fails and the market moves lower, a move down to 16,530 could be likely. Above the channel high, look for a move to 16,850.

How Would You Trade the Dax Today?
I hope this fundamental and technical Dax analysis helps you to make better informed trading decisions. Check the latest market analysis for other instruments and subscribe to receive them in your inbox as soon as they are published
DISCLAIMER: TIO Markets offers an exclusively execution-only service. The views expressed are for information purposes only. None of the content provided constitutes any form of investment advice. The comments are made available purely for educational and marketing purposes and do NOT constitute advice or investment recommendation (and should not be considered as such) and do not in any way constitute an invitation to acquire any financial instrument or product. TIOmarkets and its affiliates and consultants are not liable for any damages that may be caused by individual comments or statements by TIOmarkets analysis and assumes no liability with respect to the completeness and correctness of the content presented. The investor is solely responsible for the risk of his/her investment decisions. The analyses and comments presented do not include any consideration of your personal investment objectives, financial circumstances, or needs. The content has not been prepared in accordance with any legal requirements for financial analysis and must, therefore, be viewed by the reader as marketing information. TIOmarkets prohibits duplication or publication without explicit approval.

Janne Muta holds an M.Sc in finance and has over 20 years experience in analysing and trading the financial markets.
Related Posts


Trade responsibly: CFDs are complex instruments and come with a high risk of losing all your invested capital due to leverage.