DAX Technical Analysis | Market Trades Near the Bear Channel Top
BY Janne Muta
|November 7, 2023Dax technical analysis - The higher yields in the US and the dollar strength have been weighing on the DAX after the strong rally last week. This has created an environment where traders have taken profits near the bear channel top the DAX trades in.
Last week's rally was boosted by speculation that the Fed was done hiking rates, and investors would continue pouring money into stocks after a strong quarterly earnings season. Now, the Fed's Kashkari has suggested more needs to be done to tame inflation, and the Fed might have to hike rates further.
Summary of This Dax Technical Analysis Report:
- Last week, the DAX surged, surpassing the prior week's high, with technical indicators like the Stochastic Oscillator signaling a buy, hinting at potential further gains in the German stock market.
- In the daily chart the DAX is retreating from a high, with bearish signals from the Stochastic Oscillator and moving averages. Failure to breach 15,268 could lead to a drop, while a rally could signal a bullish channel breakout.
- The 4-hour DAX chart indicates bearishness. A failure to break above 15,150 suggests a downtrend continuation. A bullish scenario requires the market to penetrate this level.
Read the full Dax Technical Analysis report below.
Dax Technical Analysis
Weekly Dax Technical Analysis
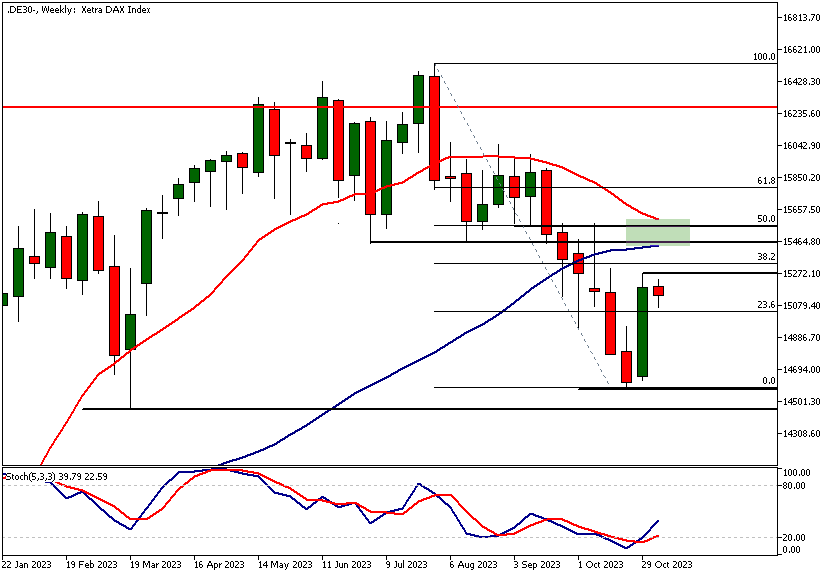
Last week, the DAX rallied over 3.6%, taking the market well above the previous week's high. This upmove prompted the Stochastic Oscillator to give a buy signal. These technical factors suggest the market could have further upside ahead.
The next weekly resistance area is at the 15,454 - 15,575 range and could be targeted by the bulls. The 50% Fibonacci retracement level, along with the SMA(50) and SMA(20), roughly coincides with this area, adding to its technical importance. Alternatively, should the upside momentum fail to continue, a move down to 14,954 and then to the levels near the last week's low could be likely.
Daily Dax Technical Analysis
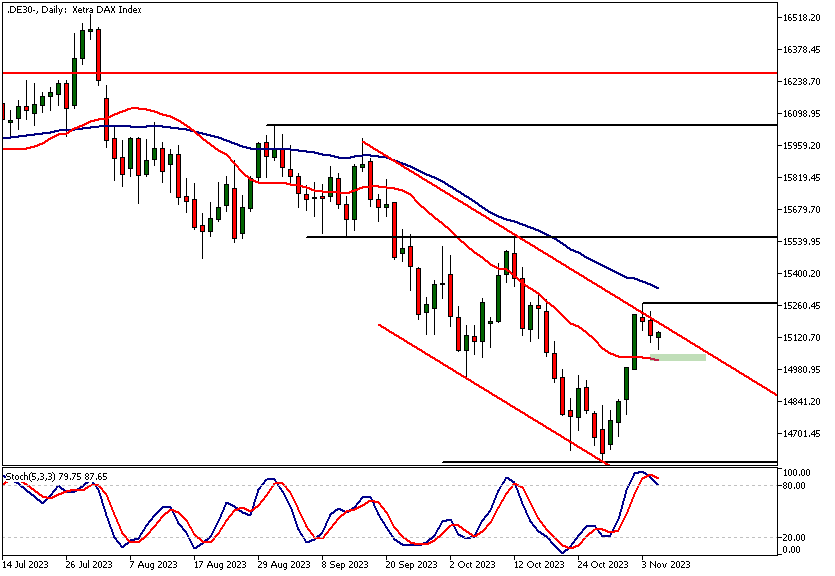
The daily chart shows the DAX reacting lower from the bearish channel top, and the Stochastic Oscillator has given a sell signal. The moving averages are bearish, indicating the market is still in a downtrend.
If this weakness cannot be reversed and the market fails to decidedly break above the 15,268 high, we might see it trading down to 14,600 again. There aren't many support levels above this major low. Alternatively, a strong rally above 15,268 would create a bullish channel breakout and open the way to 15,560 or so.
Dax Technical Analysis, 4h
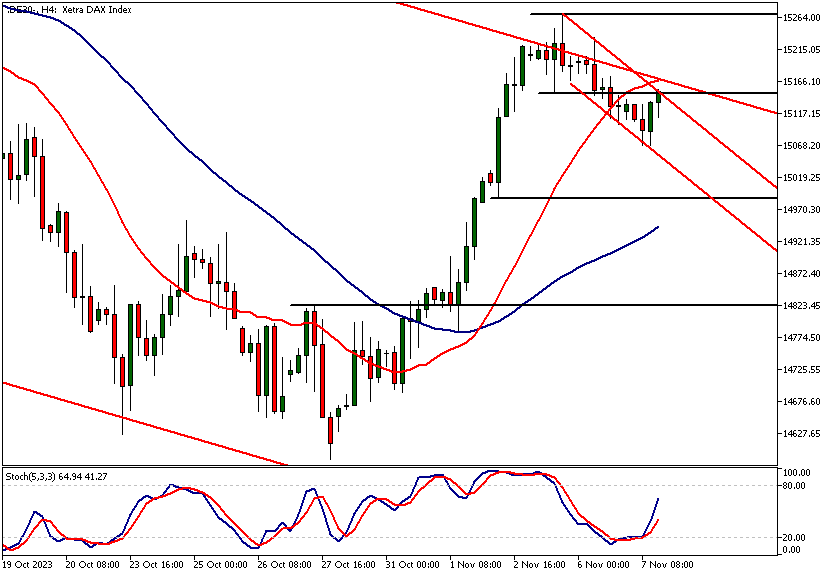
The 4-hour chart reveals another bearish price channel with the market trading below a confluence area created by the channel top and a market structure level at 15,150. A strong rally above this level could move the market to the 15,268 high.
Alternatively, a lack of commitment from the bulls could see the market trading down to 15,020. The moving averages are bullish, but as always, it is the price action itself, and especially price action near key market structure levels, that counts. As long as 15,150 isn't penetrated, the market remains bearish.
Client sentiment analysis
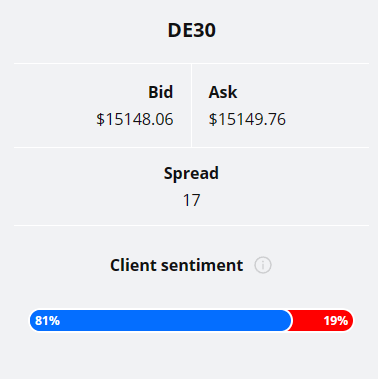
TIOmarkets' clientele are bullish on Dax, with 81% of clients holding long positions and only 19% shorting the market.
Please remember that the retail trader client sentiment is a contrarian indicator as most of the retail traders are on average betting against the market trends. This is why, experienced traders tend to trade against the retail client sentiment. You can follow the TIOmarkets client sentiment live on our Forex dashboard.
The next key risk events impacting this market:
- USD - FOMC Member Waller Speaks
- USD - Unemployment Claims
- USD - Fed Chair Powell's Speech
- ECB President Lagarde's Speech
- USD - Prelim UoM Consumer Sentiment
- USD - Prelim UoM Inflation Expectations

Potential Dax Market Moves
The daily chart shows the DAX reacting lower from the bearish channel top, and the Stochastic Oscillator has given a sell signal. The moving averages are bearish, indicating the market is still in a downtrend. If this weakness cannot be reversed and the market fails to decidedly break above the 15,268 high, we might see it trading down to 14,600 again.
Last week DAX rallied over 3.6% taking the market well above the previous week's high. This upmove prompted the Stochastic Oscillator to give a buy signal. These technical factors suggest the market could have further upside ahead.
How would you trade the Dax today?
I hope this fundamental and technical Dax analysis helps you to make better informed trading decisions. Check the latest market analysis for other instruments and subscribe to receive them in your inbox as soon as they are published
DISCLAIMER: TIO Markets offers an exclusively execution-only service. The views expressed are for information purposes only. None of the content provided constitutes any form of investment advice. The comments are made available purely for educational and marketing purposes and do NOT constitute advice or investment recommendation (and should not be considered as such) and do not in any way constitute an invitation to acquire any financial instrument or product. TIOmarkets and its affiliates and consultants are not liable for any damages that may be caused by individual comments or statements by TIOmarkets analysis and assumes no liability with respect to the completeness and correctness of the content presented. The investor is solely responsible for the risk of his/her investment decisions. The analyses and comments presented do not include any consideration of your personal investment objectives, financial circumstances, or needs. The content has not been prepared in accordance with any legal requirements for financial analysis and must, therefore, be viewed by the reader as marketing information. TIOmarkets prohibits duplication or publication without explicit approval.

Janne Muta holds an M.Sc in finance and has over 20 years experience in analysing and trading the financial markets.
Related Posts


Trade responsibly: CFDs are complex instruments and come with a high risk of losing all your invested capital due to leverage.