Divergence Forex Trading Strategy Revealed: A Complete Guide
BY Panagiotis Philippou
|March 12, 2026The divergence forex trading strategy is one of the most widely used techniques for identifying potential market reversals and trend continuation opportunities. Traders use divergence to detect when price action and momentum indicators begin moving in opposite directions, which may signal weakening market momentum.
In simple terms, divergence occurs when price makes a new high or low while an indicator such as the Relative Strength Index (RSI), Moving Average Convergence Divergence (MACD), or Stochastic Oscillator fails to confirm that move. This difference between price and indicator behavior can provide valuable clues about potential changes in market direction.
Understanding the divergence forex trading strategy can help traders identify higher-probability setups, manage risk more effectively, and build a structured trading approach.
In this guide, you will learn:
- what divergence means in trading
- the different types of divergence signals
- how to build a divergence trading plan forex traders can follow
- common mistakes traders make when using divergence
- practical strategies for applying divergence in real trading conditions
What Is Divergence in Forex Trading?
Divergence occurs when price movement and a technical indicator move in opposite directions.
Momentum indicators measure the strength of a trend. When price continues moving in one direction but the indicator weakens, it may indicate that the trend is losing strength.
This concept forms the foundation of the divergence forex trading strategy.
For example:
- Price makes a higher high
- RSI makes a lower high
This suggests bullish momentum may be weakening, even though price is still rising.
However, divergence does not guarantee a reversal. Instead, it serves as a warning signal that traders often combine with other technical tools.
Types of Divergence in Forex Trading
Understanding the different divergence types is essential when developing a divergence trading plan forex traders can apply consistently.
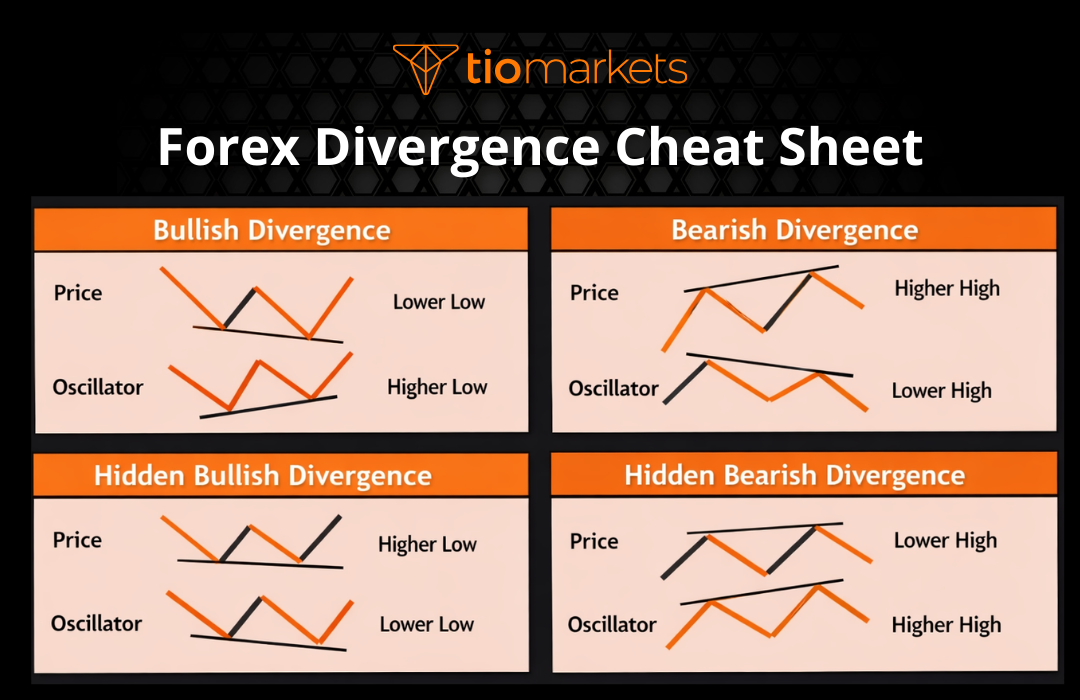
Regular Divergence
Regular divergence often signals a potential trend reversal.
Bullish Divergence
Occurs when:
- price forms a lower low
- indicator forms a higher low
This may indicate selling pressure is weakening.
Bearish Divergence
Occurs when:
- price forms a higher high
- indicator forms a lower high
This may suggest buying momentum is slowing.
Hidden Divergence
Hidden divergence usually signals trend continuation rather than reversal.
Hidden Bullish Divergence
Occurs when:
- price forms a higher low
- indicator forms a lower low
This may suggest the uptrend remains strong.
Hidden Bearish Divergence
Occurs when:
- price forms a lower high
- indicator forms a higher high
This may indicate the downtrend may continue.
Indicators Used in a Divergence Forex Trading Strategy
Several indicators are commonly used when traders apply divergence analysis.
The most popular ones include:
Relative Strength Index (RSI)
RSI measures momentum on a scale from 0 to 100 and is widely used for identifying divergence signals.
MACD (Moving Average Convergence Divergence)
MACD helps traders identify momentum shifts and trend changes.
Stochastic Oscillator
The stochastic indicator measures the position of price relative to recent highs and lows.
Commodity Channel Index (CCI)
CCI helps identify overbought and oversold market conditions.
Each of these indicators can help traders identify opportunities when developing a divergence forex strategy planning framework.
How to Build a Divergence Trading Plan Forex Traders Can Use
One of the biggest mistakes traders make is relying on divergence signals alone. A successful divergence trading plan forex traders can follow usually includes several additional steps.
Step 1: Identify the Trend
Before using divergence signals, determine the overall market trend.
Traders often use:
- moving averages
- trendlines
- market structure
This helps determine whether the divergence may signal a reversal or continuation.
Step 2: Wait for Divergence Confirmation
Once price reaches a key level, traders look for divergence between price and momentum indicators.
Key confirmation signals may include:
- RSI divergence
- MACD histogram weakening
- Stochastic divergence
Step 3: Combine Divergence With Support and Resistance
Divergence signals become more reliable when they occur near:
- support levels
- resistance levels
- trendlines
- Fibonacci retracement levels
This combination strengthens the overall trading setup.
Step 4: Define Entry Rules
A typical divergence trading entry might include:
- divergence confirmation
- candlestick confirmation
- break of a minor trendline
For example:
A trader may enter a long position after bullish divergence forms and a bullish candlestick pattern appears.
Step 5: Define Risk Management Rules
Risk management is essential when applying the divergence forex trading strategy.
Common rules include:
- risking 1–2% of trading capital per trade
- placing stop-loss orders beyond recent highs or lows
- using proper position sizing
Example of a Divergence Forex Trading Strategy
Consider a scenario where EUR/USD is trending upward.
- Price forms a higher high
- RSI forms a lower high
- Resistance level appears near the price zone
A trader may interpret this as bearish divergence, suggesting the uptrend may be losing strength.
The trader might then wait for:
- bearish candlestick confirmation
- a break below support
before entering a short trade.
This type of structured approach is an important part of divergence forex strategy planning.
Advantages and Limitations of Divergence Trading
Like any strategy, divergence trading has strengths and weaknesses.
| Advantage | Explanation |
| Early warning signals | Divergence can appear before price reversals |
| Works in multiple markets | Applicable to forex, indices, and commodities |
| Combines well with other tools | Can be used with support, resistance, and price action |
| Limitation | Explanation |
| False signals | Divergence can appear multiple times before a reversal |
| Requires confirmation | Should not be traded in isolation |
| Trend strength matters | Strong trends may continue despite divergence |
Understanding these limitations helps traders create more realistic expectations when applying the divergence forex trading strategy.
Common Mistakes When Trading Divergence
Many traders struggle with divergence strategies because they apply them incorrectly.
Common mistakes include:
Trading Divergence Too Early
Markets can remain in strong trends even after divergence appears.
Ignoring Market Structure
Divergence signals become more reliable near key support and resistance levels.
Using Divergence Alone
Divergence works best when combined with:
- price action
- trend analysis
- market structure
Tools That Can Help Traders Use Divergence
Modern trading platforms provide tools that simplify divergence analysis.
Examples include:
- advanced charting tools
- multiple indicator overlays
- economic calendars
- automated alerts
Many platforms allow traders to monitor multiple markets including forex, indices, and commodities from one interface.
How Long Does It Take to Master Divergence Trading?
Developing a profitable strategy using divergence typically takes time.
Most traders improve through:
- chart study
- backtesting strategies
- practicing in demo accounts
- maintaining a trading journal
Learning how to build a divergence trading plan requires patience and consistent evaluation of past trades. You can take the first step by opening a trading account
Final Thoughts
The divergence forex trading strategy is a powerful technique for identifying potential trend reversals and continuation opportunities. By analyzing the relationship between price action and momentum indicators, traders can gain deeper insight into market strength.
However, divergence works best when integrated into a structured trading plan. Combining divergence signals with support and resistance levels, price action confirmation, and proper risk management can significantly improve trade selection.
Traders who focus on divergence forex strategy planning, disciplined risk management, and continuous learning are more likely to develop consistent decision-making over time.
Financial markets always involve risk, but a well-structured approach can help traders navigate market conditions more effectively.

FAQ
Risk disclaimer: CFDs are complex instruments and come with a high risk of losing money rapidly due to leverage. You should consider whether you understand how CFDs work and whether you can afford to take the high risk of losing your money. Never deposit more than you are prepared to lose. Professional client’s losses can exceed their deposit. Please see our risk warning policy and seek independent professional advice if you do not fully understand. This information is not directed or intended for distribution to or use by residents of certain countries/jurisdictions including, but not limited to, USA & Countries included in the OFAC sanction list. The Company holds the right to alter the aforementioned list of countries at its own discretion.
TIOmarkets offers an exclusively execution-only service. The views expressed are for information purposes only. None of the content provided constitutes any form of investment advice. The comments are made available purely for educational and marketing purposes and do NOT constitute advice or investment recommendation (and should not be considered as such) and do not in any way constitute an invitation to acquire any financial instrument or product. TIOmarkets and its affiliates and consultants are not liable for any damages that may be caused by individual comments or statements by TIOmarkets analysis and assumes no liability with respect to the completeness and correctness of the content presented. The investor is solely responsible for the risk of his/her investment decisions. The analyses and comments presented do not include any consideration of your personal investment objectives, financial circumstances, or needs. The content has not been prepared in accordance with any legal requirements for financial analysis and must, therefore, be viewed by the reader as marketing information. TIOmarkets prohibits duplication or publication without explicit approval.
Join us on social media
Authors BIO

Panagiotis is an online trading specialist with extensive experience in forex, indices, and commodities. He enjoys sharing his experience to help traders better understand global financial markets.


