Dow Jones Technical Analysis | Best three week rally since October 2022
BY Janne Muta
|November 17, 2023Dow Jones Technical Analysis – The US equity indices have seen a significant rebound with Dow Jones Industrial Average (DJ) recording its best three-week stretch since October 2022. This surge reflects a shift in investor sentiment from bearish to bullish, largely influenced by recent actions from the U.S. Treasury and the Federal Reserve.
The Treasury's decision to implement a smaller-than-expected increase in long-term debt auctions with no further interest rate hikes expected from the Fed, has created a more favorable investment environment.
These policy moves have positively impacted both stocks and bonds, pushing yields lower. Consequently, this has boosted investor confidence and optimism in the market, fostering a belief in the stability and potential growth of US equities.
Summary of This Dow Jones Technical Analysis Report:
- DJ has rallied to a market structure level (35,096) that resisted price advances in August. The market has rallied approximately 8% since the low four weeks ago in a move that has been the strongest 3-week rally since October 2022.
- If DJ can maintain this upside momentum above 35,096, we could see the market move to 35,576. Should the market trade sharply lower, we should look for signs of buying re-emerging in price action near the 34,410 level.
- The Treasury's decision to implement a smaller-than-expected increase in long-term debt auctions with no further interest rate hikes expected from the Fed, has created a more favorable investment environment.
Read the full Dow Jones Technical Analysis report below.
Dow Jones Technical Analysis
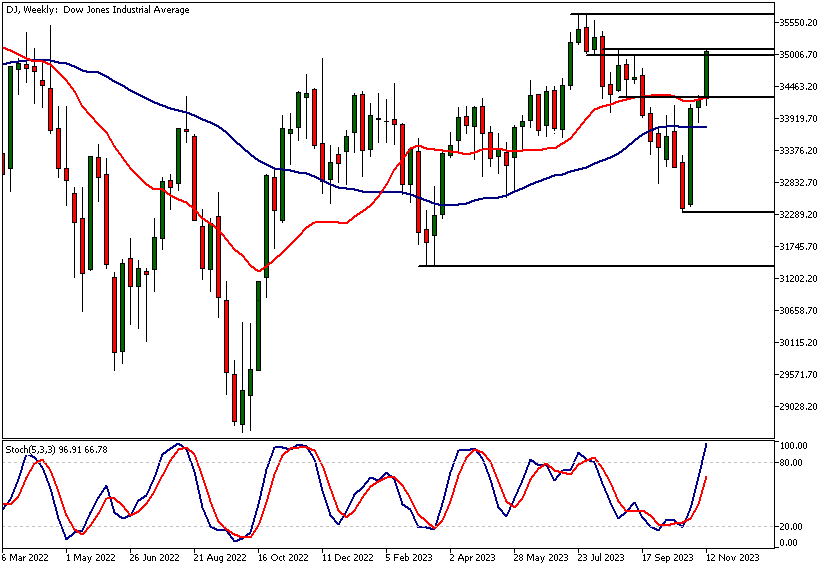
Weekly Dow Jones Technical Analysis
DJ has rallied to a market structure level (35,096) that resisted price advances in August. The market has rallied approximately 8% since the low four weeks ago in a move that has been the strongest 3-week rally since October 2022.
No signs yet of rally slowing down
The strength of the up move has pushed the stochastic oscillator into the overbought area and has moved the market well above the moving averages. This leaves the DJ only 1.7% from the July high, while there are no signs of this rally slowing down in the weekly chart.
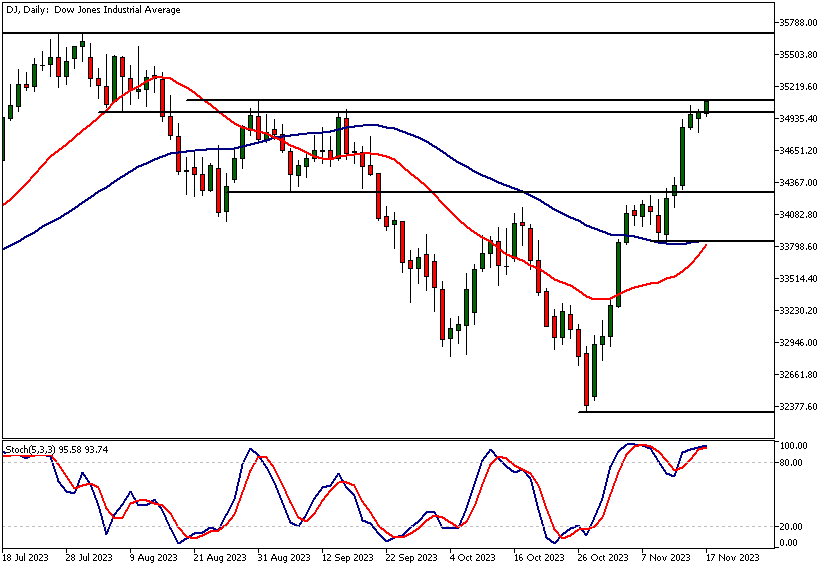
Daily Dow Jones Technical Analysis
The substantial move has mainly taken place over four or five trading days showing how the market participants are discounting the future cash flows that are much more valuable in the lower interest rate environment expected next year.
The Fed funds futures traders are currently pricing in four rate cuts for the next year, and the fund managers have been adjusting their portfolios accordingly.
Potential market moves
Our Dow Jones technical analysis suggests that if the market can maintain this upside momentum above 35,096, we could see the market move to 35,576. Should the market trade sharply lower, we should look for signs of buying re-emerging in price action near the 34,410 level.
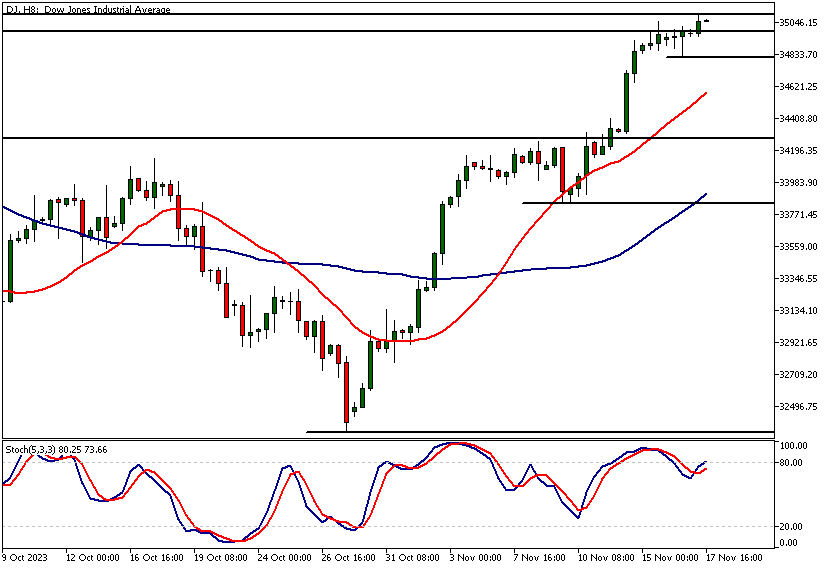
Dow Jones Technical Analysis, 8h
The 8h chart reveals a minor support level at 34,814. Above this level, the market looks ready to test if it can keep on pushing higher by attracting more buying above the market structure level identified in the weekly Dow Jones technical analysis section above (every market needs new inflows to keep advancing).
If the 34,814 level is decisively broken, we could see a corrective move down to 34,410 or so. Traders should monitor if this level attracts buyers.
The next key risk events impacting this market:
- Existing Home Sales
- FOMC Meeting Minutes
- Unemployment Claims
- Core Durable Goods Orders
- Durable Goods Orders
- Revised UoM Consumer Sentiment
- Flash Manufacturing PMI
- Flash Services PMI
Potential Dow Jones Market Moves
Dow Jones technical analysis indicates that if DJ can maintain upside momentum above 35,096, we could see the market move to 35,576. Should the market trade sharply lower, we should look for signs of buying re-emerging in price action near the 34,410 level.

How would you trade the Dow Jones today?
I hope this Dow Jones technical analysis helps you to make better informed trading decisions. Check the latest market analysis for other instruments and subscribe to receive them in your inbox as soon as they are published
DISCLAIMER: TIO Markets offers an exclusively execution-only service. The views expressed are for information purposes only. None of the content provided constitutes any form of investment advice. The comments are made available purely for educational and marketing purposes and do NOT constitute advice or investment recommendation (and should not be considered as such) and do not in any way constitute an invitation to acquire any financial instrument or product. TIOmarkets and its affiliates and consultants are not liable for any damages that may be caused by individual comments or statements by TIOmarkets analysis and assumes no liability with respect to the completeness and correctness of the content presented. The investor is solely responsible for the risk of his/her investment decisions. The analyses and comments presented do not include any consideration of your personal investment objectives, financial circumstances, or needs. The content has not been prepared in accordance with any legal requirements for financial analysis and must, therefore, be viewed by the reader as marketing information. TIOmarkets prohibits duplication or publication without explicit approval.

Janne Muta holds an M.Sc in finance and has over 20 years experience in analysing and trading the financial markets.
Related Posts


Trade responsibly: CFDs are complex instruments and come with a high risk of losing all your invested capital due to leverage.