Dow Jones Technical Analysis | DJIA is approaching the July high
BY Janne Muta
|November 27, 2023Dow Jones Technical Analysis – The US equity indices rally has been remarkable. Indices have now completed their fourth consecutive week of gains. This period has been characterized by the best monthly performance for major indices like the Dow Jones Industrial Average, S&P 500, and Nasdaq Composite this year.
A key factor influencing market dynamics has been the Federal Reserve's interest rate policies. There is increasing speculation that the Fed might halt further rate hikes and could reduce rates in 2024 by four times.
At the same time signs of economic cooling, such as layoffs and reduced job growth suggest a potential easing of inflation without precipitating a recession. According to WSJ, despite recent market rallies, investor sentiment remains cautious, with record amounts of cash held in money-market funds.
This liquidity, seen as a bullish indicator by some analysts, suggests potential for further market investments if the inflation outlook improves, highlighting a cautious optimism in financial markets amidst prevailing economic uncertainties.
Summary of This Dow Jones Technical Analysis Report:
- The Dow Jones Industrial Average (DJIA) is approaching a pivotal point, the July high of 35,680, marking a significant juncture in its weekly trajectory. This approach follows a notable rally, with the market climbing over 9% in just four weeks.
- In the daily timeframe chart, the market show a robust bullish trend, evidenced by just five down days since the October low. There's a consistent pattern of printing higher low values, indicative of a strong upward push.
Read the full Dow Jones Technical Analysis report below.
Dow Jones Technical Analysis
Weekly Dow Jones Technical Analysis
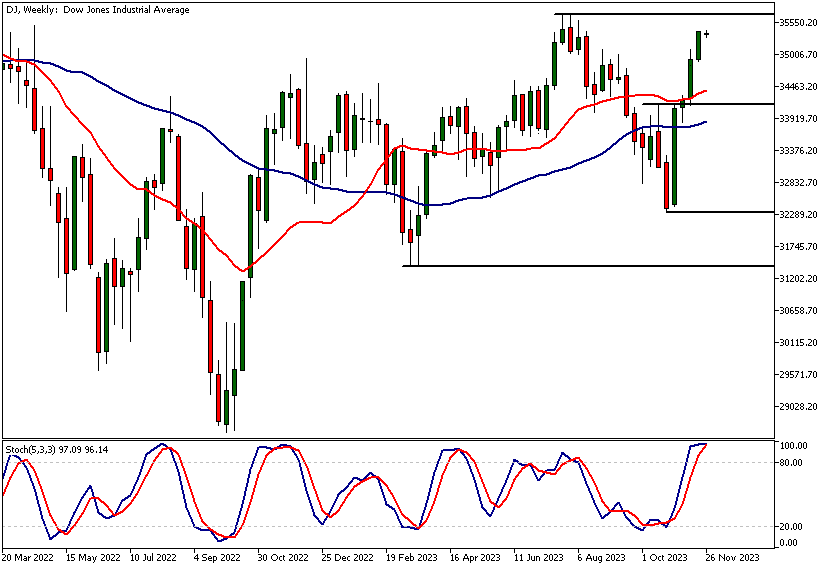
The Dow Jones Industrial Average (DJIA) is approaching a pivotal point, the July high of 35,680, marking a significant juncture in its weekly trajectory. This approach follows a notable rally, with the market climbing over 9% in just four weeks.
Indicator-oriented Dow Jones technical analysis highlights how the moving averages are currently trending upwards, indicating a positive momentum. Note, however, that Stochastic indicator being in overbought territory could hint at a potential slowdown in the near future.
The nearest key support level on the weekly chart is found at 34,145, while the nearest major resistance is at the July high of 35,680, a level that may prove challenging to breach.
Daily Dow Jones Technical Analysis
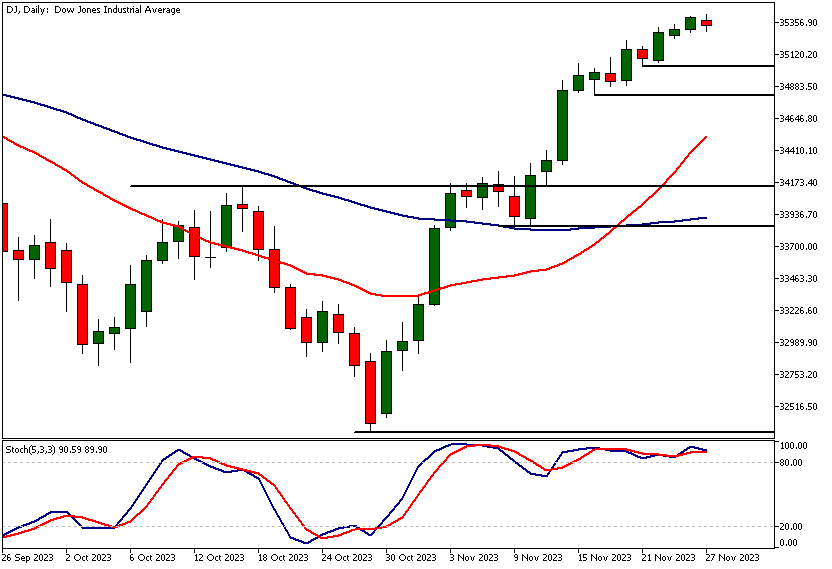
In the daily timeframe chart, the market show a robust bullish trend, evidenced by just five down days since the October low. There's a consistent pattern of printing higher low values, indicative of a strong upward push.
Indicator based Dow Jones technical analysis supports the bullish view. The Short-Term Moving Average (SMA 20) and the Medium-Term Moving Average (SMA 50) are both pointing higher, with SMA 20 trading above SMA 50, reinforcing the bullish sentiment.
In terms of support and resistance, the daily chart shows key support levels at 34,814 and 35,036, while the major resistance mirrors the weekly chart at the July high of 35,680.
Dow Jones Technical Analysis, 2h
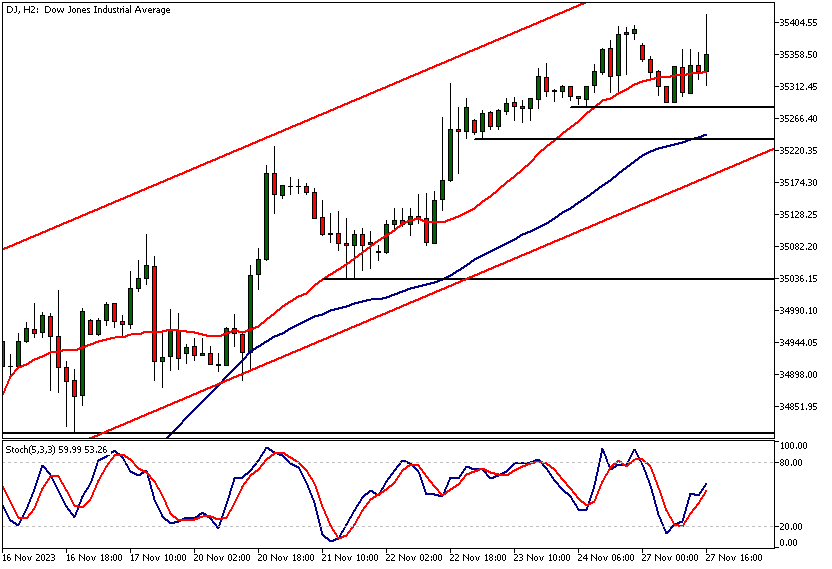
The intraday (2-hour) chart reveals a bullish trend channel, with moving averages also pointing upwards. This reinforces the positive sentiment observed in longer timeframes. The nearest intraday support levels are identified at 35,239 and 35,284, with SMA 50 aligning with the 35,239 support level.
The next key risk events impacting this market
- USD - S&P/CS Composite-20 HPI
- USD - CB Consumer Confidence
- USD - Richmond Manufacturing Index
- USD - FOMC Member Waller Speaks
- USD - Prelim GDP
- USD - Prelim GDP Price Index
- USD - Core PCE Price Index
- USD - Unemployment Claims
- USD - Chicago PMI
- USD - Pending Home Sales
- USD - ISM Manufacturing PMI
- USD - ISM Manufacturing Prices
- USD - Fed Chair Powell Speaks
Potential Dow Jones Market Moves
Above 35,060 look for a move to July high of 35,680. Alternatively, if the market fails to attract buyers above the 35,060 level, a move down to 34,800 or so.

How would you trade the Dow Jones today?
I hope this fundamental and technical Dow Jones analysis helps you to make better informed trading decisions. Check the latest market analysis for other instruments and subscribe to receive them in your inbox as soon as they are published
DISCLAIMER: TIO Markets offers an exclusively execution-only service. The views expressed are for information purposes only. None of the content provided constitutes any form of investment advice. The comments are made available purely for educational and marketing purposes and do NOT constitute advice or investment recommendation (and should not be considered as such) and do not in any way constitute an invitation to acquire any financial instrument or product. TIOmarkets and its affiliates and consultants are not liable for any damages that may be caused by individual comments or statements by TIOmarkets analysis and assumes no liability with respect to the completeness and correctness of the content presented. The investor is solely responsible for the risk of his/her investment decisions. The analyses and comments presented do not include any consideration of your personal investment objectives, financial circumstances, or needs. The content has not been prepared in accordance with any legal requirements for financial analysis and must, therefore, be viewed by the reader as marketing information. TIOmarkets prohibits duplication or publication without explicit approval.

Janne Muta holds an M.Sc in finance and has over 20 years experience in analysing and trading the financial markets.
Related Posts
Trade responsibly: CFDs are complex instruments and come with a high risk of losing all your invested capital due to leverage.

