Dow Jones Technical Analysis | DJIA trades in new highs for the year
BY Janne Muta
|December 13, 2023Dow Jones Technical Analysis – The release of the US inflation data yesterday sparked a notable rise in key stock indices, with The S&P 500, Dow Jones Industrial Average, and Nasdaq Composite each reaching new 52-week highs. This surge reflects a growing belief among investors in the potential achievement of a 'soft landing' for the US economy.
The US equity markets saw a boost as the US Core Consumer Price Index (CPI) for November matched predictions. Excluding food and energy, the Core CPI increased by 0.3% from the previous month. The year-on-year core CPI was recorded at 4%, the lowest since September 2021 and in line with expectations.
Overall, consumer prices showed a 0.1% month-on-month increase, driven by higher housing costs and lower gasoline prices, surpassing the anticipated steady rate. The annual inflation rate decreased to 3.1% in November, meeting forecasted figures. Today’s PPI numbers matched market expectations at 0.0% (-0.4% prior) while the core PPI came in below expectations at 0.0% vs. 0.2% expected.
In today's Federal Reserve meeting, no change in interest rates is anticipated. Traders in the Fed Funds Futures market are almost certain (98% probability) that the Fed will maintain current rates. Looking ahead to next year, expectations are that the Fed will begin rate reductions in May. Following the release of the stronger-than-anticipated Core CPI data, the likelihood of a rate cut is currently at 80.3%.
Summary of This Dow Jones Technical Analysis Report:
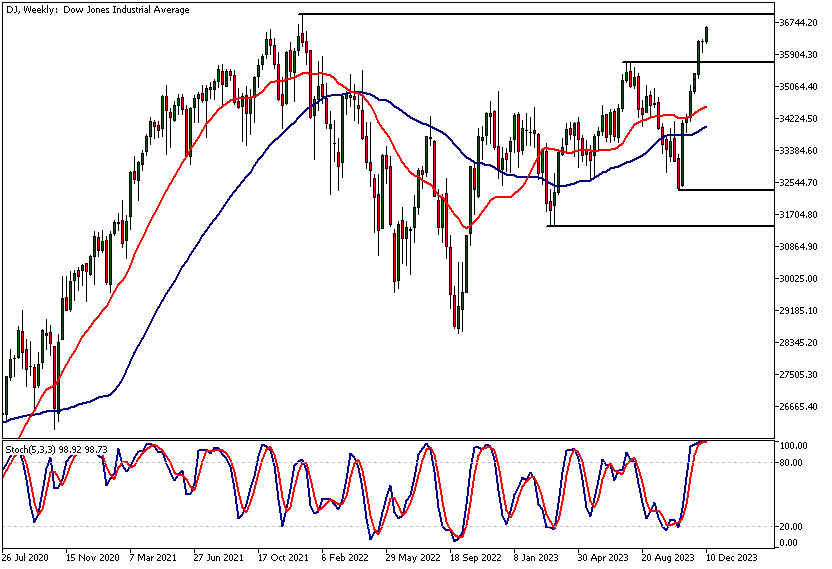
- The Dow Jones Index is close to its January 2022 peak, with a 13% rise since October and no down weeks. However, as it nears its all-time high, there's an increased risk of profit-taking. The nearest weekly support is at 35,686, but current technical analysis shows no signs of weakness.
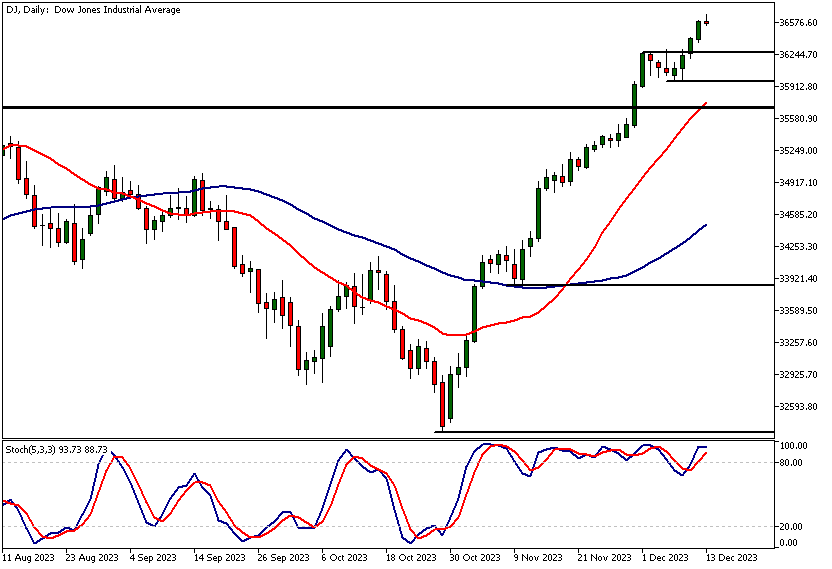
- Daily: The Dow Jones' daily chart shows sustained rally momentum, breaking out with two wide-range candles. Support levels are at 35,975 and 36,264, with bullish trends above these. The 20-period moving average is above the 50-period average, indicating upward momentum. Stochastic oscillators in the overbought zone may not be significant during strong uptrends.
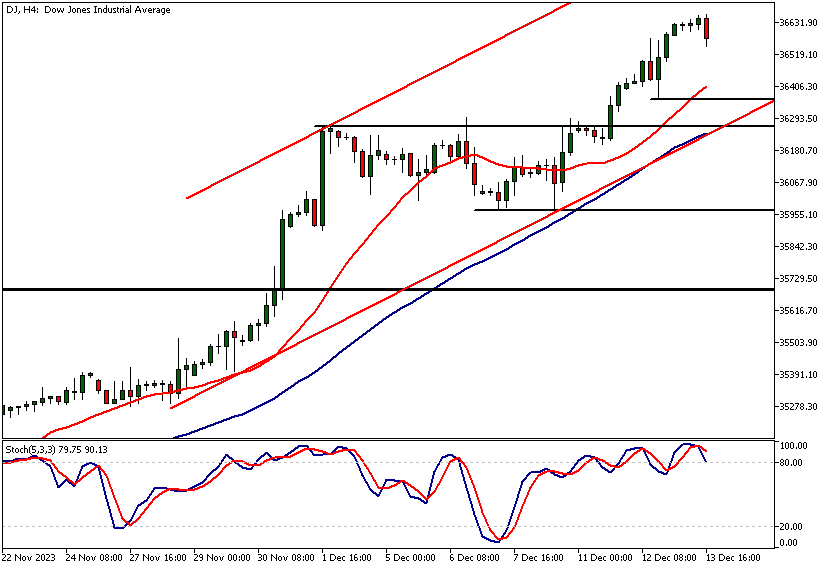
- The 4-hour chart indicates a key support level at 36,365, close to the 20-period moving average, marking a crucial technical point. A drop below this level could lead to the next support at 36,264, near the ascending trend channel low and the 50-period SMA at 36,230, creating a support range between 36,230 and 36,264.
Read the full Dow Jones Technical Analysis report below.
Dow Jones Technical Analysis
Weekly Dow Jones Technical Analysis
The Dow Jones Index is nearing its all-time high from January 2022, having rallied over 13% since its October low. Remarkably, there have been no down weeks since the start of this rally.
However, as the market approaches or enters an all-time high, the risk of profit-taking, which could slow down the rally, substantially increases. If the market retraces, the nearest weekly support level at 35,686 might come into play. Yet, current Dow Jones technical analysis reveals no signs of weakness on the weekly chart.
Daily Dow Jones Technical Analysis
On the daily chart, the rally has persisted following a brief pause last week. After breaking out of a sideways range, the market has formed two wide-range candles, indicating strong momentum in Dow Jones stocks. Key support levels are identified at 35,975 and 36,264. The market remains bullish above these levels, while a fall below 35,975 could lead to a decline towards 35,700.
Moving average based Dow Jones technical analysis corroborates the price action analysis, showing strong upward momentum. The 20-period moving average is steeply ascending and positioned above the 50-period moving average, with the market trading well above the 20-period average.
Oscillator indications in trending markets
The stochastic oscillator has been in the overbought territory for most of this rally, which may not be significant. It's important for new traders to understand that oscillators often remain in the overbought area during strong uptrends, so other analysis methods are preferable in these situations.
Intraday Dow Jones Technical Analysis
Intraday analysis shows the nearest 4-hour support level at 36,365 aligns closely with the 20-period moving average, creating a technical confluence that enhances its importance.
If the market retraces to this level but fails to attract buyers, a decline to the next support level at 36,264 may occur. It’s noteworthy that this support level is near the ascending trend channel low, which coincides with the 50-period SMA (currently at 36,230), creating a potential support range between 36,230 and 36,264.
Client sentiment analysis
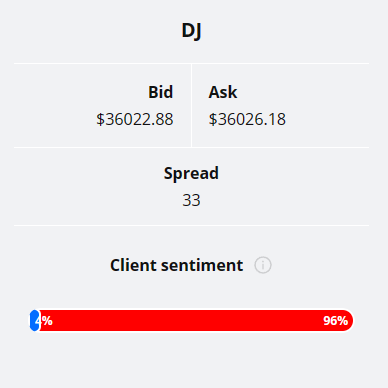
34% of clients trading Dow Jones are holding long positions, while 66% are holding short positions. Client sentiment data is being provided by TIO Markets Ltd.
It’s good to remember that retail client trading sentiment is a contrarian indicator as most retail traders are on average trading against market price trends. This is why experienced traders tend to trade against the retail client sentiment. You can follow the TIOmarkets client sentiment live on our Forex dashboard.
The next key risk events impacting this market
- USD - Federal Funds Rate
- USD - FOMC Economic Projections
- USD - FOMC Statement
- USD - FOMC Press Conference
- USD - Retail Sales and Core Retail Sales
- USD - Unemployment Claims
- USD - Empire State Manufacturing Index
- USD - Industrial Production
- USD - Flash Manufacturing PMI
- USD - Flash Services PMI
Potential Dow Jones Market Moves
The Dow Jones Index, nearing its all-time high, shows strong upward momentum, with no signs of weakness on the weekly chart. The daily chart's breakout with wide-range candles and the market trading well above the 20-period moving average suggest continued bullishness.
If the Dow falls below key daily support levels at 35,975, a further decline towards 35,700 is possible. Intraday, a failure to hold the 4-hour support at 36,365 could see a drop to the next support level at 36,264.

How Would You Trade the Dow Jones Today?
I hope this fundamental and technical Dow Jones analysis helps you to make better informed trading decisions. Check the latest market analysis for other instruments and subscribe to receive them in your inbox as soon as they are published
DISCLAIMER: TIO Markets offers an exclusively execution-only service. The views expressed are for information purposes only. None of the content provided constitutes any form of investment advice. The comments are made available purely for educational and marketing purposes and do NOT constitute advice or investment recommendation (and should not be considered as such) and do not in any way constitute an invitation to acquire any financial instrument or product. TIOmarkets and its affiliates and consultants are not liable for any damages that may be caused by individual comments or statements by TIOmarkets analysis and assumes no liability with respect to the completeness and correctness of the content presented. The investor is solely responsible for the risk of his/her investment decisions. The analyses and comments presented do not include any consideration of your personal investment objectives, financial circumstances, or needs. The content has not been prepared in accordance with any legal requirements for financial analysis and must, therefore, be viewed by the reader as marketing information. TIOmarkets prohibits duplication or publication without explicit approval.

Janne Muta holds an M.Sc in finance and has over 20 years experience in analysing and trading the financial markets.
Related Posts


Trade responsibly: CFDs are complex instruments and come with a high risk of losing all your invested capital due to leverage.