Dow Jones Technical Analysis | Equities under pressure after Powell's Comments
BY Janne Muta
|November 10, 2023Dow Jones Technical Analysis – US equities traded lower yesterday, with declining stocks on the NYSE outnumbering the advancing ones by a rate of almost three to one. Comments from Federal Reserve Chair Jerome Powell contributed to the downturn in the stock market.
He cautioned that declaring victory against inflation prematurely would be a mistake, suggesting the possibility of further policy tightening: 'If it becomes appropriate to tighten policy further, we will not hesitate to do so.'
This statement led to a downturn in investor sentiment, resulting in declines across major stock indices, including the Dow Jones. However, Fed Funds Futures trades are still betting that the Fed will cut rates three times next year, beginning in June.
Summary of This Dow Jones Technical Analysis Report:
- Following a strong rally last week, the Dow Jones Industrial Average is now facing selling pressure, near a key area comprising the 20-period moving average. Key support and resistance levels are identified at 32,324 and 35,013, respectively.
- After closing below 33,972, the market shows signs of weakness, indicated by a bearish candle pattern and a close below the 33,972 level.
Read the full Dow Jones Technical Analysis report below.
Dow Jones Technical Analysis
Weekly Dow Jones Technical Analysis
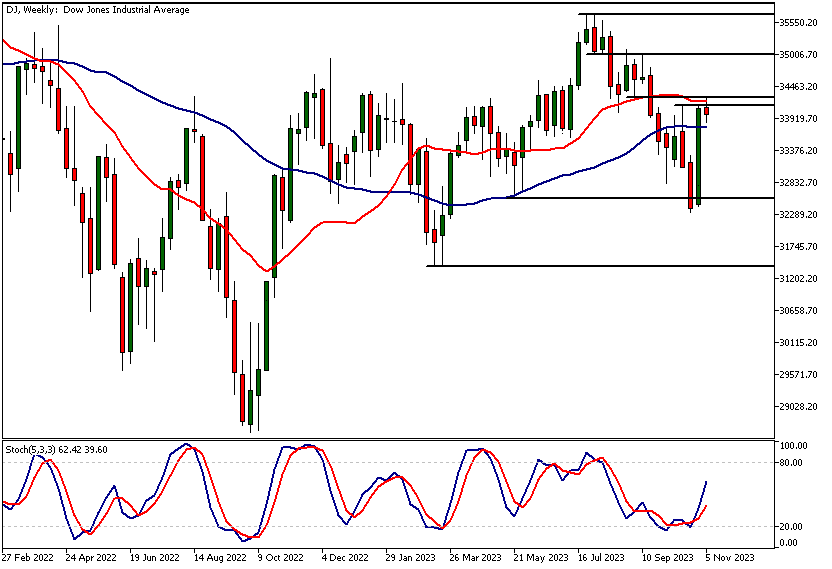
After rallying strongly last week, the Dow Jones Industrial Average has been trading lower this week. The confluence area that turned the market lower (at 34,145 - 34,287) contains the 20-period moving average and two market structure levels.
The blue-chip index could now be correcting lower following the hawkish comments from Fed Chair Powell and some other Fed officials. The nearest major support level in the Dow is at 32,324, while the next major resistance level above this week's high is at 35,013.
Daily Dow Jones Technical Analysis
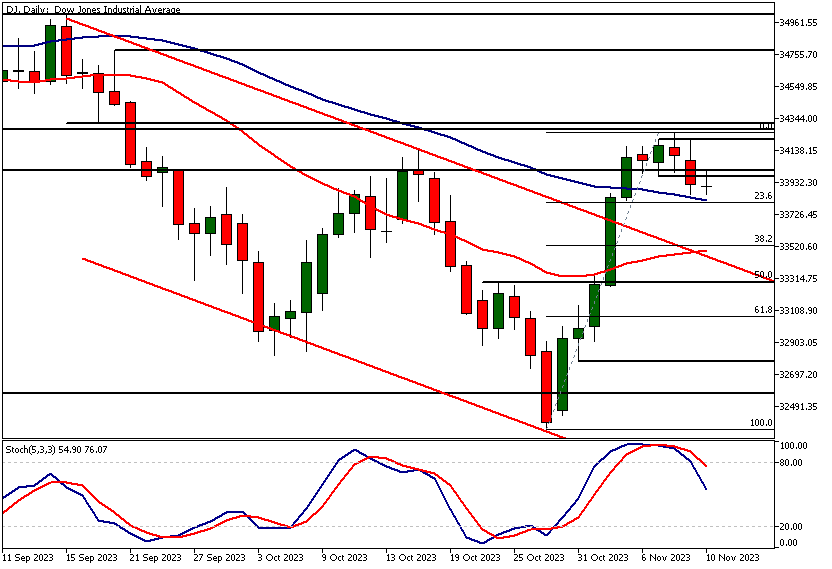
The market has now closed below a key support level at 33,972, turning this former support level into a resistance level. Note how the candle from the day before yesterday was a narrow-range candle, showing both indecisiveness and lack of upside momentum.
This is typical after the market has rallied strongly to a resistance level and signifies a potential turning point in the market. Then the day was followed by a bearish candle with a close below the previous day's low yesterday. Therefore, our Dow Jones Technical analysis indicates, the line of least resistance should be to the downside and could lead to further weakness in the DJIA.
Key technical levels
The nearest potential support level on the daily chart is at 33,496, where the 20-period moving average and the channel top coincide. Note also that the 38.2% Fibonacci retracement level is nearby. The next significant technical level can be found at 33,291. If the weakness continues, traders could be targeting either of these price levels.
Alternatively, should the market rally decisively above the 33,993 level, we could see the market trading in the 34,220 to 34,250 range.
Dow Jones Technical Analysis, 2h
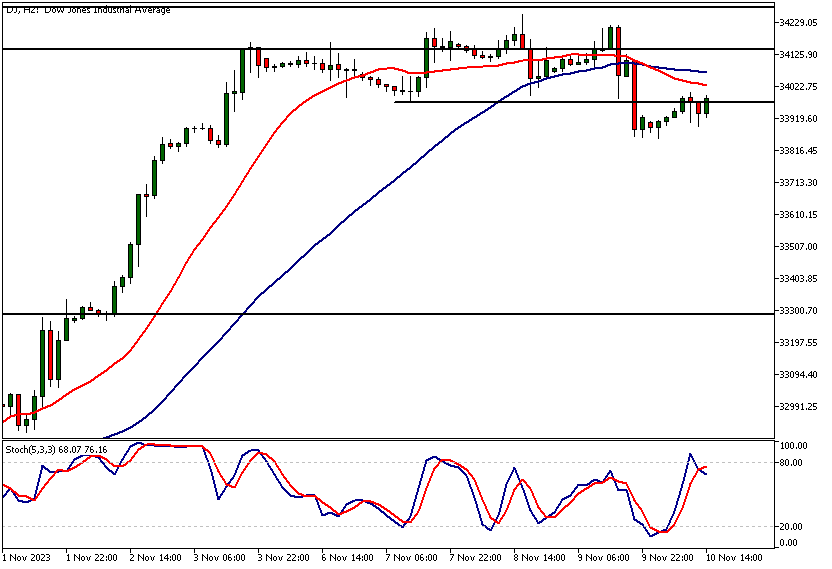
The 2-hour chart shows the market struggling at 33,972. If this level can't be penetrated, the 50-period moving average at 33,780 could come into play.
Dow Jones technical analysis shows how a measured move projection based on the 2-hour price range created over the last 2 days points to 33,645. This level could act as an intraday price target for the bears.
Bullish scenario
Alternatively, above the 33,972 level, intraday traders could be targeting 34,150. Note how the stochastic oscillator has given a sell signal, as the DJIA continues to struggle at the resistance level.
The next key risk events impacting this market:
- Prelim UoM Consumer Sentiment
- Prelim UoM Inflation Expectations
- CPI
- Empire State Manufacturing Index
Potential Dow Jones Market Moves
The market has now closed below a key support level at 33,972, turning this former support level into a resistance level.
If this weakness continues, the 50-period moving average at 33,780 could come into play. A measured move projection based on the 2-hour price range created over the last 2 days points to 33,645. This level could act as an intraday price target for the bears.
Alternatively, above the 33,993 level, we could see the market trading in the 34,220 to 34,250 range.

How would you trade the Dow Jones today?
I hope this fundamental and technical Dow Jones analysis helps you to make better informed trading decisions. Check the latest market analysis for other instruments and subscribe to receive them in your inbox as soon as they are published
DISCLAIMER: TIO Markets offers an exclusively execution-only service. The views expressed are for information purposes only. None of the content provided constitutes any form of investment advice. The comments are made available purely for educational and marketing purposes and do NOT constitute advice or investment recommendation (and should not be considered as such) and do not in any way constitute an invitation to acquire any financial instrument or product. TIOmarkets and its affiliates and consultants are not liable for any damages that may be caused by individual comments or statements by TIOmarkets analysis and assumes no liability with respect to the completeness and correctness of the content presented. The investor is solely responsible for the risk of his/her investment decisions. The analyses and comments presented do not include any consideration of your personal investment objectives, financial circumstances, or needs. The content has not been prepared in accordance with any legal requirements for financial analysis and must, therefore, be viewed by the reader as marketing information. TIOmarkets prohibits duplication or publication without explicit approval.

Janne Muta holds an M.Sc in finance and has over 20 years experience in analysing and trading the financial markets.
Related Posts


Trade responsibly: CFDs are complex instruments and come with a high risk of losing all your invested capital due to leverage.