Dow Jones Technical Analysis | Lower rates could boost stocks
BY Janne Muta
|January 19, 2024Dow Jones Technical Analysis – Yesterday Dow and other major US equity indices gained, with technology stocks leading the surge with seven out of the 11 S&P sectors ending higher led by technology, communication services and industrials.
The Dow Jones Industrial Average rose by 0.5% or 202 points after the market had lost ground for three consecutive days. The S&P 500 increased by 0.9%, the Nasdaq Composite by 1.3%. This rally was largely driven by the technology and industrial sectors, which saw a 2% and 1.35% rise respectively. Utilities and real estate lost the most, down 1.07% and 0.65%.
WSJ reports that Increasing interest rates have attracted trillions of dollars into money-market funds last couple of years. Almost 9 trillion dollars were invested in money market funds and certificates of deposit (CDs) by Q3 2023. As the interest rates are expected to decrease, these funds will be reallocated to other assets in the near future, possibly providing fuel for the next bull run in the equity markets.
Recently Atlanta Federal Reserve President Raphael Bostic and Fed Governor Christopher Waller played down rate cut expectations though. Bostic has stated that inflation might fluctuate if policymakers reduce rates prematurely, echoing Fed governor Christopher Waller's advice not to hastily lower interest rates until there is clear and sustained evidence of lower inflation.
Summary of This Dow Jones Technical Analysis Report:
- Dow technical analysis suggests that if the current sideways move is resolved to the upside, we could see the market moving to the measured move target (38,500) based on the range width and then perhaps further. On the downside (below 37,183), look for a move to 36,550.
- Yesterday and the day before, the market tried to break the 37,212 support level but failed, which resulted in a rally. This indicates bullish momentum could move the market towards the range high at 37,821. Alternatively, look for a retracement back to 37,320.
- The 8h chart shows how both 20 and 50-period moving averages are clustered at levels where the rally stopped yesterday. They are closely aligned with market structure levels at 37,490 and 37,542, forming a confluence area. The 20 period SMA has crossed below the SMA50, indicating bearishness but the strong momentum in the daily chart indicates the bulls could eventually push beyond the confluence zone.
Read the full Dow Jones Technical Analysis report below.
Dow Jones Technical Analysis
Weekly Dow Jones Technical Analysis
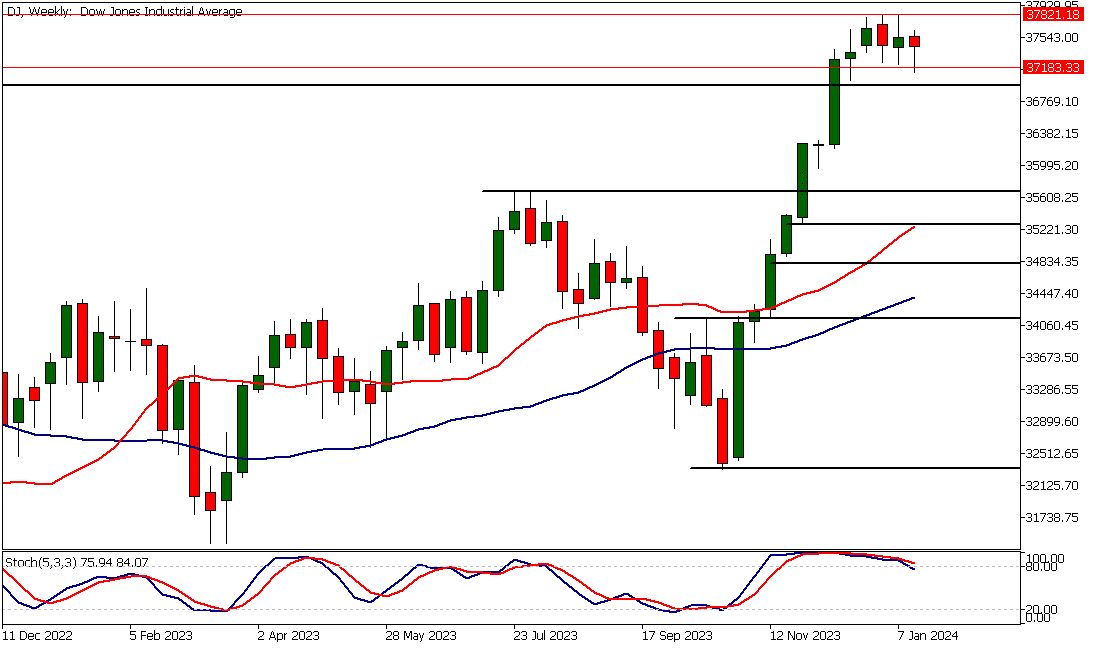
The Dow continues to consolidate above the old all-time high (36,953) created a year ago in January 2022. It is common for the markets to move sideways after sudden and extended runs as profit-taking slows the market down. This is reflected in the stochastic oscillator as it points lower. The moving averages still indicate a bullish market, but the distance between the averages and the current market price is now exceptional, increasing the risk of mean reversion behaviour in the market.
Dow technical analysis suggests that if the current sideways move is resolved to the upside, we could see the market moving to the measured move target (38,500) based on the range width and then perhaps further. On the downside (below 37,183), look for a move to 36,550.
The nearest weekly resistance level is the range high at 37,812, while the nearest key support level below the 37,183 (range low) is the old all-time high level at 36,953. If there is a decisive break below this level, look for a move down to 36,350.
Daily Dow Jones Technical Analysis
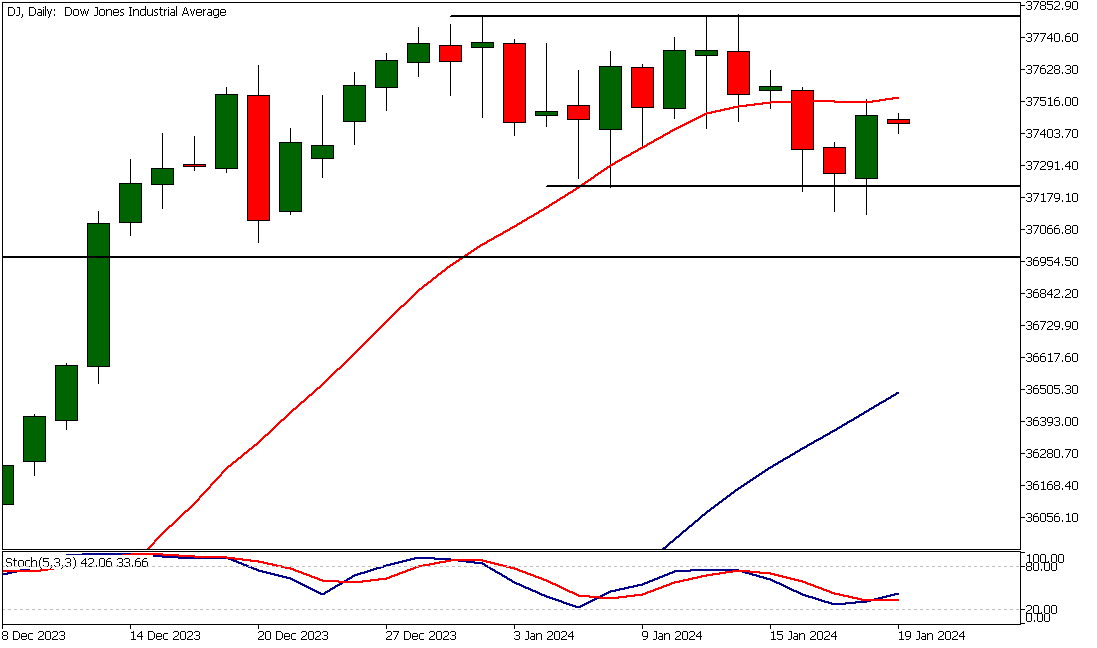
Yesterday and the day before, the market tried to break the 37,212 support level but failed, which resulted in a rally. This indicates bullish momentum could move the market towards the range high at 37,821.
The stochastic oscillator has given a buy signal after yesterday's strong rally. This suggests traders should focus on price action around key intraday levels in today's trading to see if the upside momentum continues.
Yesterday's rally was thwarted at the SMA(20), but if the market can rally decisively above it, Dow technical analysis indicates we could see a move to 37,800 or so. Alternatively, look for a retracement back to 37,320.
Intraday Dow Jones Technical Analysis
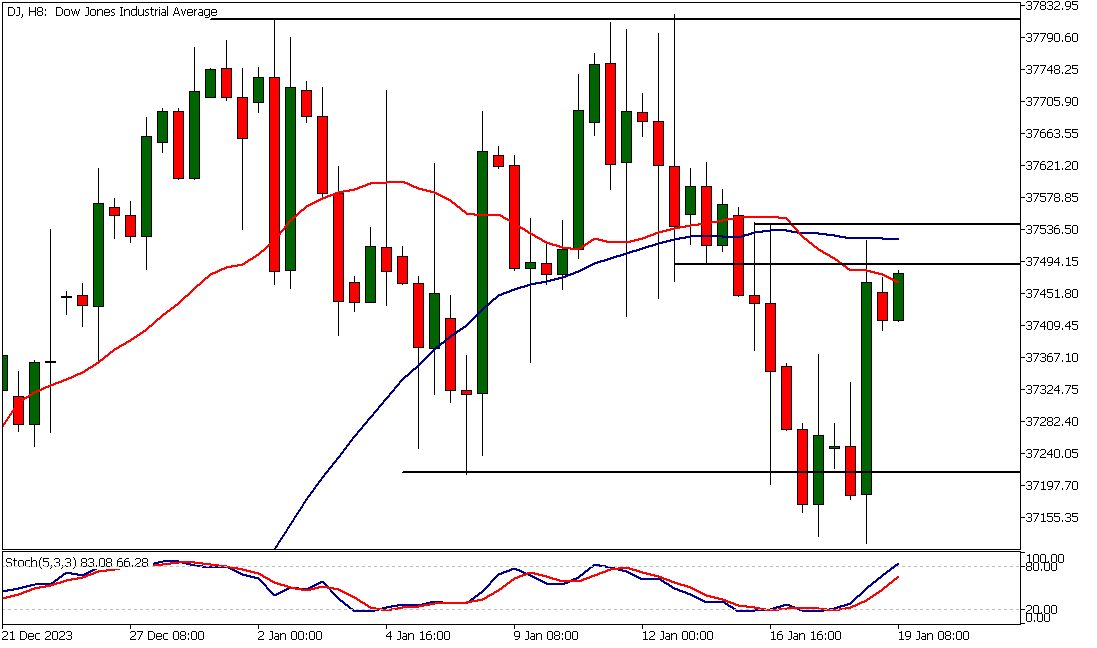
The 8h chart shows how both 20 and 50-period moving averages are clustered at levels where the rally stopped yesterday. They are closely aligned with market structure levels at 37,490 and 37,542, forming a confluence area.
The 20 period SMA has crossed below the SMA50, indicating bearishness but the strong momentum in the daily chart indicates the bulls could eventually push beyond the confluence zone. As noted in the daily Dow technical analysis section above, this could open the way to levels near the range high at 38,000.
The market remains bullish above 37,400. A break below the level could see Dow trading down to 37,320.
Client sentiment analysis
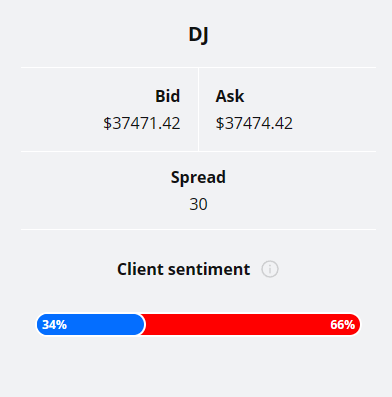
34% of clients trading Dow Jones are holding long positions, while 66% are holding short positions. Client sentiment data is being provided by TIO Markets Ltd.
Please note that retail client trading sentiment is generally a contrarian indicator, as private (non-professional) traders, on average, trade against market price trends. You can follow the TIOmarkets client sentiment live on our Forex dashboard.
The next key risk events impacting this market
- USD - Prelim UoM Consumer Sentiment
- USD - Existing Home Sales
- USD - Prelim UoM Inflation Expectations
Potential Dow Jones Market Moves
Dow technical analysis suggests that if the current sideways move is resolved to the upside, we could see the market moving to the measured move target (38,500) based on the range width and then perhaps further. On the downside (below 37,183), look for a move to 36,550.

How Would You Trade the Dow Jones Today?
I hope this fundamental and technical Dow Jones analysis helps you to make better informed trading decisions. Check the latest market analysis for other instruments and subscribe to receive them in your inbox as soon as they are published
DISCLAIMER: TIO Markets offers an exclusively execution-only service. The views expressed are for information purposes only. None of the content provided constitutes any form of investment advice. The comments are made available purely for educational and marketing purposes and do NOT constitute advice or investment recommendation (and should not be considered as such) and do not in any way constitute an invitation to acquire any financial instrument or product. TIOmarkets and its affiliates and consultants are not liable for any damages that may be caused by individual comments or statements by TIOmarkets analysis and assumes no liability with respect to the completeness and correctness of the content presented. The investor is solely responsible for the risk of his/her investment decisions. The analyses and comments presented do not include any consideration of your personal investment objectives, financial circumstances, or needs. The content has not been prepared in accordance with any legal requirements for financial analysis and must, therefore, be viewed by the reader as marketing information. TIOmarkets prohibits duplication or publication without explicit approval.

Janne Muta holds an M.Sc in finance and has over 20 years experience in analysing and trading the financial markets.
Related Posts


Trade responsibly: CFDs are complex instruments and come with a high risk of losing all your invested capital due to leverage.