Dow Jones Technical Analysis | Near Oversold Levels in the Weekly Timeframe?
BY Janne Muta
|November 1, 2023Dow Jones technical analysis - Major stock indexes rose on Tuesday ahead of the Fed rate decision today, but faced their third consecutive monthly decline. The Dow Jones Industrial Average gained 0.2% after rallying by 1.46% the day before. On monthly basis the Dow shed 2.1% in October.
The S&P 500 increased by 0.6% yesterday, ending October down by 2.2%. While sectors like real estate and banking witnessed gains, earnings-related selloffs impacted the overall index.
This three-month stock dip aligns with a pause in interest rate hikes. Fed officials are expected to maintain current rates but haven't ruled out future increases. Market dynamics suggest investor caution, with some expecting a rebound as interest rates stabilize.
Summary of This Dow Jones Technical Analysis Report:
- The Dow has declined 9.5% from the June high, nearing the 50% Fibonacci level. It recovered but remains below last week's high. Dow Jones technical analysis indicates support at 31,424 and resistance between 34,145 - 34,158. The Fed's rate signals are crucial.
- The market in the daily timeframe is in a bearish channel. A key resistance area lies between 33,291 and 33,325, with the next resistance above it at 33,677.
- In the 4-hour chart, the market broke out of a bearish channel, and retraced a bit creating a minor confluence at 32,786 - 32,804. Bullish momentum persists above this, targeting 33,291.
- The Fed is expected to keep the rates untouched but the central bank has signalled it is willing to hike rates further if needed. The markets are not convinced but instead expect to see the first rate cut in June next year.
Read the full Dow Jones technical analysis report below.
Dow Jones technical analysis
Weekly Dow Jones technical analysis
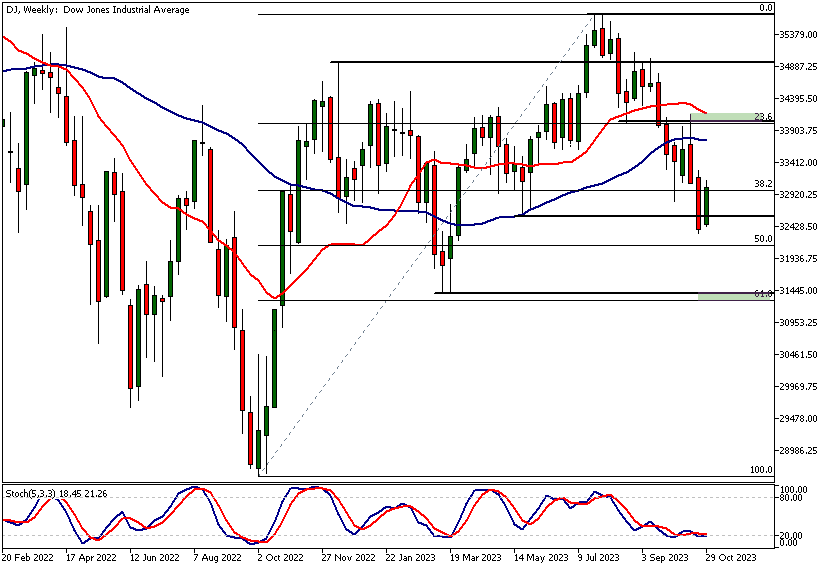
The downward movement in the Dow from the June high to last week's low was 9.5%. This took the market almost down to the 50% Fibonacci retracement level at 32,160.
The market has recovered this week but is still trading below last week's high at 33,291. The Stochastic oscillator is near the oversold territory, and the market has moved relatively far from the moving averages.
Support Level Analysis
Last week, the market moved below a key support level at 32,582. The move below was rejected, indicating that there was institutional demand under this support level. This suggests that we could see a further reversion to the mean behaviour in this market.
Fed Rate Decision
However, all this is subject to what the Fed signals today about future rate hikes. Fed funds futures traders do not expect the FED to hike rates today, but if the central bank signals that it will keep the rates higher for longer, then we could see further weakness in the US stock market.
Dow Jones technical analysis shows the nearest major weekly support level below the 32,582 level at 31,424 (coinciding with the 61.8% retracement level). The nearest significant resistance area is found at 34,145 - 34,158.
This technical confluence area is created by a market structure level, the 23.6% Fibonacci retracement level, and the 20-period SMA. However, at the same time, the 33,291 level is a significant price level that could determine future price action.
Daily Dow Jones technical analysis
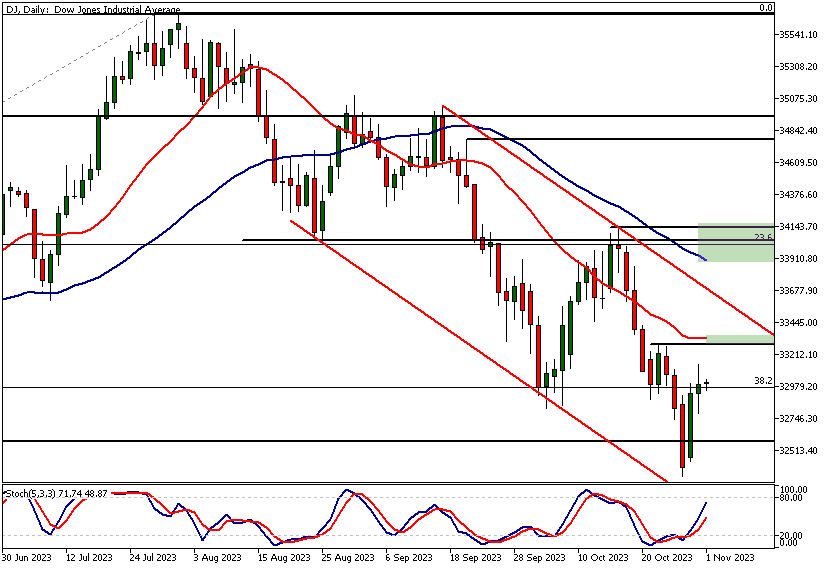
In the daily timeframe chart, the market is trending lower in a bearish trend channel. The nearest technical confluence area at 33,291 - 33,325 is created by the 20-period moving average and a market structure level. Above this level, the next resistance can be found at the bear channel high, currently at 33,677. Above this, look for a move to the 33,900 - 34,145 range.
The key threshold level
This confluence area contains the SMA(50), the 23.6% Fibonacci retracement level, and two market structure levels. Our Dow Jones technical analysis suggests that for the bulls to gain momentum, they first need to push the market above the 33,325 level and attract follow-through buying. If the market fails to challenge this level, we should anticipate a move down to around 32,325.
Note how yesterday's candle wasn't a strong bullish one and failed to close near the range high. This lack of upside momentum is likely due to profit-taking ahead of the FOMC rate decision today. This emphasizes the significance of price action analysis following the Fed rate decision.

Dow Jones technical analysis, 4h chart
The 4-hour timeframe chart shows a breakout from a bearish trend channel. Since then, the market has successfully tested the 20-period moving average and bounced higher from it. This has created a minor confluence area at 32,786 - 32,804.
The market remains bullish above this level and could trade up to 33,291. A decisive break below this minor confluence area could lead the market to trade down to around 32,580. This is roughly where a market structure level and the high end of the bearish trend channel coincide.
Indicator based Dow Jones technical analysis
Indicator-based Dow Jones technical analysis indicates the market is still in a downtrend, but the 20-period moving average has begun to turn higher, suggesting the downtrend is weakening. This is corroborated by price action analysis that shows the market breaking out of the bearish trend channel.
Client sentiment analysis
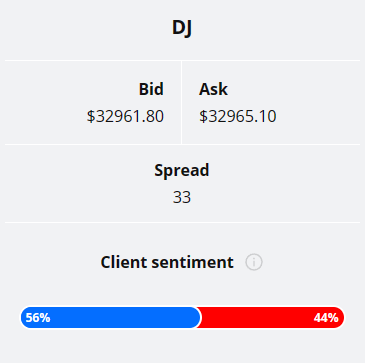
TIOmarkets' clients are mildly bullish on DJIA with 56% of them currently holding long positions in the DJ, while 44% of them are short the market.
Please remember that the retail trader client sentiment is a contrarian indicator as most of the retail traders are on average betting against the market trends. This is why, experienced traders tend to trade against the retail client sentiment. You can follow the TIOmarkets client sentiment live on our Forex dashboard.
The key risk events impacting this market today:
- ISM Manufacturing PMI
- JOLTS Job Openings
- ISM Manufacturing Prices
- Federal Funds Rate
- FOMC Statement
- FOMC Press Conference

Potential Dow Jones Industrial Average Market Moves
Following a breakout from the bearish channel in the 4-hour timeframe, and bolstered by a bounce from the 20-period moving average, the market could be targeting the 33,291 level and potentially even the 33,900 - 34,145 range on the daily chart. Positive price action post-Fed announcement, combined with the weakening downtrend suggests this is a possibility.
Despite the recent breakout from the bearish trend channel on the 4-hour chart, if the Fed signals a hawkish stance, it could lead to a decisive break below the minor confluence area of 32,786 - 32,804.
How would you trade the DJIA today?
I hope this fundamental and technical Dow Jones analysis helps you to make better informed trading decisions. Check the latest market analysis for other instruments and subscribe to receive them in your inbox as soon as they are published
DISCLAIMER: Tio Markets offers an exclusively execution-only service. The views expressed are for information purposes only. None of the content provided constitutes any form of investment advice. The comments are made available purely for educational and marketing purposes and do NOT constitute advice or investment recommendation (and should not be considered as such) and do not in any way constitute an invitation to acquire any financial instrument or product. TIOmarkets and its affiliates and consultants are not liable for any damages that may be caused by individual comments or statements by TIOmarkets analysis and assumes no liability with respect to the completeness and correctness of the content presented. The investor is solely responsible for the risk of his/her investment decisions. The analyses and comments presented do not include any consideration of your personal investment objectives, financial circumstances, or needs. The content has not been prepared in accordance with any legal requirements for financial analysis and must, therefore, be viewed by the reader as marketing information. TIOmarkets prohibits duplication or publication without explicit approval.
Join us on social media

Janne Muta holds an M.Sc in finance and has over 20 years experience in analysing and trading the financial markets.
Related Posts


Trade responsibly: CFDs are complex instruments and come with a high risk of losing all your invested capital due to leverage.