Dow Jones Technical Analysis | Rallying DJIA hits new yearly high
BY Janne Muta
|December 1, 2023Dow Jones Technical Analysis – Dow Jones technical analysis - The market has rallied over 11% in just 5 weeks, moving well beyond the July High of 35,679. This rally, marking the strongest 5-week period in over a year, echoes a similar surge in November 2022, when the index experienced a 13.79% increase.
The Dow Jones Industrial Average achieved a new high for the year, alongside substantial gains in other major equity indices.
The bond market also saw a substantial rally, with the yield on the 10-year U.S. Treasury note dropping significantly, leading to the largest monthly decline since 2019. This decline in yields and an uptick in bond prices reflect growing investor expectations that the Federal Reserve may cut interest rates next year.
The view has been reinforced by the easing of inflation and reduced consumer spending as reported by the Commerce Department earlier this week.
Despite these positive signs, there remains some caution among US consumers. Consumer Confidence, though improved to 102 in November, still reflects concerns over potential recession, high prices, and geopolitical tensions. Moreover, the Federal Reserve, while facing milder inflation gauges, continues to express caution over loosening its economic grip too soon.
Summary of This Dow Jones Technical Analysis Report:
- The market has rallied over 11% in just 5 weeks, moving well beyond the July High of 35,679. This rally, marking the strongest 5-week period in over a year, echoes a similar surge in November 2022, when the index experienced a 13.79% increase. If this robust momentum continues, the market could soon be testing the all-time high of 36,953.
- The market remains bullish in the daily chart, as reflected in the moving averages. Indicator-based Dow Jones technical analysis shows the market trading well above the 20-period moving average, which is itself above the 50-period SMA. The nearest key support level below the July High is at 35,516, while the next one is at 34,814. The nearest key daily resistance level above the current market price is at 36,520.
Read the full Dow Jones Technical Analysis report below.
Dow Jones Technical Analysis
Weekly Dow Jones Technical Analysis
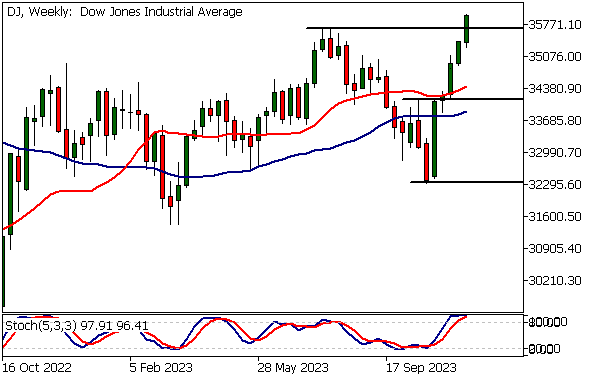
The market has rallied over 11% in just 5 weeks, moving well beyond the July High of 35,679. This rally, marking the strongest 5-week period in over a year, echoes a similar surge in November 2022, when the index experienced a 13.79% increase. If this robust momentum continues, the market could soon be testing the all-time high of 36,953.
Focus on support levels
The nearest major support level is the July high at 35,679, and the market remains bullish above it. In case of a retracement to this level, traders should focus on price action around this key support to gauge potential renewed buying interest. Conversely, if the market cannot sustain its bullish trend and falls below $35,679, a deeper retracement down to 34,700 could occur.
Indicator-oriented Dow Jones technical analysis also supports the bullish market view, with both moving averages pointing higher and the 20-period moving average positioned above the 50-period SMA.
Daily Dow Jones Technical Analysis
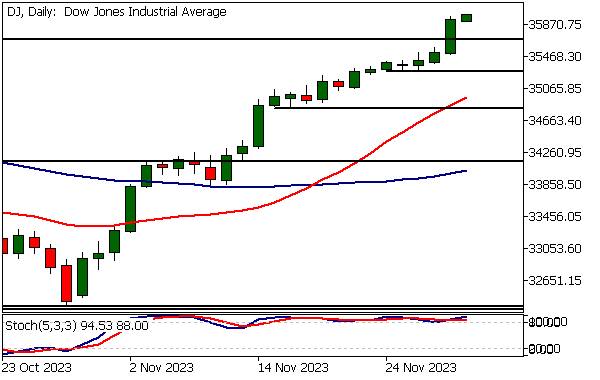
Yesterday, the Dow Jones Industrial Average rallied approximately 1.1%, closing decisively above the July high (35,679). Such rallies are relatively rare, occurring only 12.5% of the time.
The rally that started at the end of October has been notable for its strength. During this period, there have been only six days when the closing price in the Dow Jones Industrial Average CFD was below the opening price.
Bullish market conditions
The market remains bullish, as reflected in the moving averages. Indicator-based Dow Jones technical analysis shows the market trading well above the 20-period moving average, which is itself above the 50-period SMA.
The nearest key support level below the July High is at 35,516, while the next one is at 34,814. The nearest key daily resistance level above the current market price is at 36,520.
Dow Jones Technical Analysis, 1h
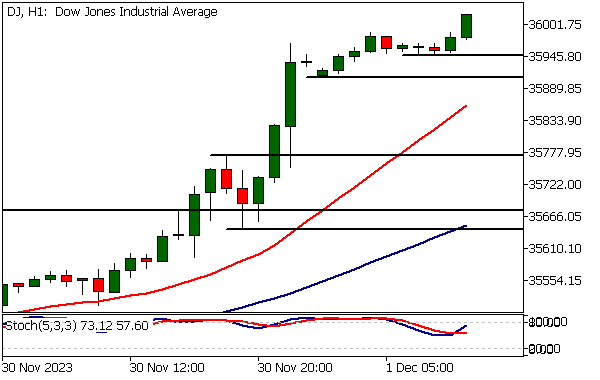
The rally has been so robust that in order to find the nearest support levels we need to study a 1-hour chart. Minor support levels are at 35,909 and 35,950.
Key support levels
The major support levels on the hourly chart, as referred to in the weekly and daily Dow Jones technical analysis sections, are at $35,644 and 35,773. If there is a retracement into this price range, traders might want to monitor for signs of renewed buying interest.
Once again, indicator-based Dow Jones technical analysis shows the market in a strong uptrend, with both moving averages pointing higher and the 20-period SMA positioned above the 50-period SMA.
Potential Dow Jones Market Moves
If the robust momentum continues, the market could soon be testing the all-time high of 36,953. The nearest major support level is the July high at 35,679, and the market remains bullish above it.
In case of a retracement to this level, traders should focus on price action around this key support to gauge potential renewed buying interest. Conversely, if the market cannot sustain its bullish trend and falls below $35,679, a deeper retracement down to 34,700 could occur.
Client sentiment analysis
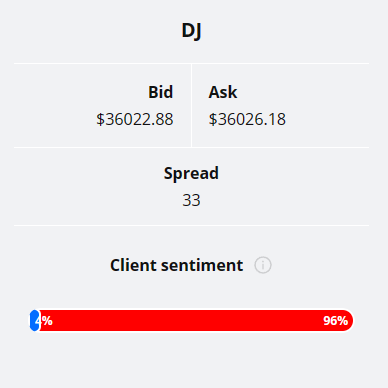
TIOmarkets' clients are extremely bearish on Dow Jones with 96% of them currently holding short positions in the market, while only 4% of them are long the market.
Please remember that the retail trader client sentiment is a contrarian indicator as most of the retail traders are on average betting against the market trends. This is why, experienced traders tend to trade against the retail client sentiment. You can follow the TIOmarkets client sentiment live on our Forex dashboard.
The next key risk events impacting this market
- ISM Manufacturing PMI
- ISM Manufacturing Prices
- Fed Chair Powell Speaks
- ISM Services PMI
- JOLTS Job Openings
- ADP Non-Farm Employment Change
- Unemployment Claims
- Average Hourly Earnings
- Non-Farm Employment Change
- Unemployment Rate
- Prelim UoM Consumer Sentiment
- Prelim UoM Inflation Expectations
Potential Dow Jones Market Moves
If the robust momentum continues, the market could soon be testing the all-time high of 36,953. The nearest major support level is the July high at 35,679, and the market remains bullish above it.
In case of a retracement to this level, traders should focus on price action around this key support to gauge potential renewed buying interest. Conversely, if the market cannot sustain its bullish trend and falls below $35,679, a deeper retracement down to 34,700 could occur.

How would you trade the Dow Jones today?
I hope this fundamental and technical Dow Jones analysis helps you to make better informed trading decisions. Check the latest market analysis for other instruments and subscribe to receive them in your inbox as soon as they are published
DISCLAIMER: TIO Markets offers an exclusively execution-only service. The views expressed are for information purposes only. None of the content provided constitutes any form of investment advice. The comments are made available purely for educational and marketing purposes and do NOT constitute advice or investment recommendation (and should not be considered as such) and do not in any way constitute an invitation to acquire any financial instrument or product. TIOmarkets and its affiliates and consultants are not liable for any damages that may be caused by individual comments or statements by TIOmarkets analysis and assumes no liability with respect to the completeness and correctness of the content presented. The investor is solely responsible for the risk of his/her investment decisions. The analyses and comments presented do not include any consideration of your personal investment objectives, financial circumstances, or needs. The content has not been prepared in accordance with any legal requirements for financial analysis and must, therefore, be viewed by the reader as marketing information. TIOmarkets prohibits duplication or publication without explicit approval.

Janne Muta holds an M.Sc in finance and has over 20 years experience in analysing and trading the financial markets.
Related Posts


Trade responsibly: CFDs are complex instruments and come with a high risk of losing all your invested capital due to leverage.